|
Download Data (XLS File) |
|
||||||||
|
||||||||
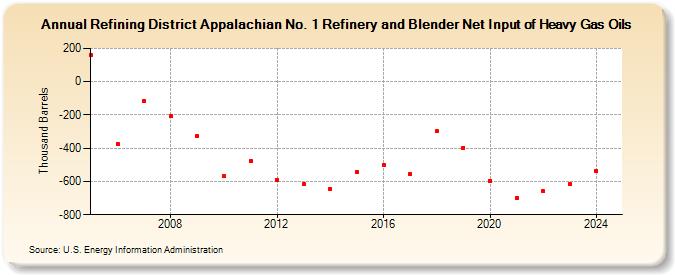
| Refining District Appalachian No. 1 Refinery and Blender Net Input of Heavy Gas Oils (Thousand Barrels) | ||||||||
| Decade | Year-0 | Year-1 | Year-2 | Year-3 | Year-4 | Year-5 | Year-6 | Year-7 | Year-8 | Year-9 |
|---|---|---|---|---|---|---|---|---|---|---|
| 2000's | 159 | -372 | -117 | -208 | -329 | |||||
| 2010's | -570 | -476 | -590 | -616 | -644 | -544 | -499 | -556 | -299 | -397 |
| 2020's | -595 | -699 | -659 | -614 |
| - = No Data Reported; -- = Not Applicable; NA = Not Available; W = Withheld to avoid disclosure of individual company data. |
| Release Date: 8/30/2024 |
| Next Release Date: 8/29/2025 |