|
Download Data (XLS File) |
|
||||||||
|
||||||||
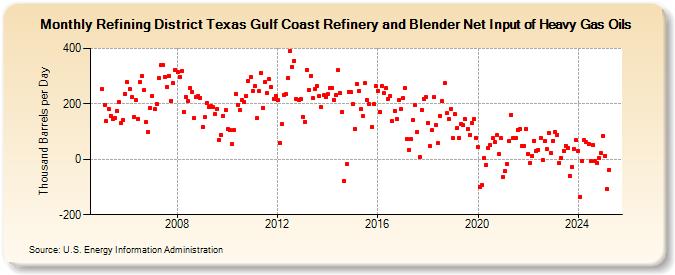
| Refining District Texas Gulf Coast Refinery and Blender Net Input of Heavy Gas Oils (Thousand Barrels per Day) | ||||||||
| Year | Jan | Feb | Mar | Apr | May | Jun | Jul | Aug | Sep | Oct | Nov | Dec |
|---|---|---|---|---|---|---|---|---|---|---|---|---|
| 2005 | 253 | 196 | 137 | 183 | 157 | 145 | 150 | 174 | 205 | 130 | 141 | 236 |
| 2006 | 277 | 252 | 223 | 153 | 213 | 146 | 277 | 299 | 249 | 134 | 99 | 186 |
| 2007 | 230 | 180 | 199 | 293 | 339 | 341 | 298 | 261 | 299 | 211 | 274 | 323 |
| 2008 | 314 | 298 | 317 | 172 | 226 | 211 | 258 | 242 | 148 | 224 | 230 | 222 |
| 2009 | 116 | 151 | 203 | 189 | 192 | 188 | 162 | 180 | 70 | 89 | 157 | 177 |
| 2010 | 108 | 105 | 54 | 106 | 235 | 197 | 178 | 213 | 207 | 230 | 283 | 297 |
| 2011 | 248 | 263 | 148 | 246 | 312 | 186 | 279 | 239 | 288 | 259 | 217 | 229 |
| 2012 | 213 | 59 | 126 | 231 | 234 | 293 | 391 | 334 | 355 | 217 | 215 | 217 |
| 2013 | 153 | 136 | 323 | 251 | 301 | 221 | 254 | 264 | 229 | 187 | 231 | 223 |
| 2014 | 234 | 257 | 257 | 214 | 231 | 321 | 238 | 171 | -78 | -18 | 244 | 241 |
| 2015 | 199 | 110 | 273 | 247 | 180 | 155 | 275 | 213 | 198 | 116 | 198 | 263 |
| 2016 | 248 | 171 | 263 | 239 | 256 | 219 | 228 | 138 | 174 | 145 | 213 | 180 |
| 2017 | 221 | 258 | 74 | 35 | 73 | 140 | 194 | 98 | 8 | 177 | 219 | 223 |
| 2018 | 132 | 47 | 105 | 225 | 122 | 57 | 157 | 209 | 275 | 166 | 146 | 182 |
| 2019 | 75 | 162 | 114 | 77 | 127 | 122 | 144 | 109 | 89 | 132 | 144 | 76 |
| 2020 | 44 | -100 | -93 | 5 | -21 | 40 | 51 | 76 | 61 | 86 | 19 | 75 |
| 2021 | -63 | -44 | -17 | 66 | 161 | 76 | 77 | 107 | 108 | 49 | 49 | 110 |
| 2022 | 20 | -12 | 13 | 67 | 31 | 35 | 77 | -4 | 65 | 36 | 96 | 24 |
| 2023 | 67 | 99 | 89 | -14 | 6 | 30 | 49 | 42 | -60 | -28 | 37 | 68 |
| 2024 | 30 | -137 | -5 | 68 | 61 | 55 | ||||||
| - = No Data Reported; -- = Not Applicable; NA = Not Available; W = Withheld to avoid disclosure of individual company data. |
| Release Date: 8/30/2024 |
| Next Release Date: 9/30/2024 |