|
Download Data (XLS File) |
|
||||||||
|
||||||||
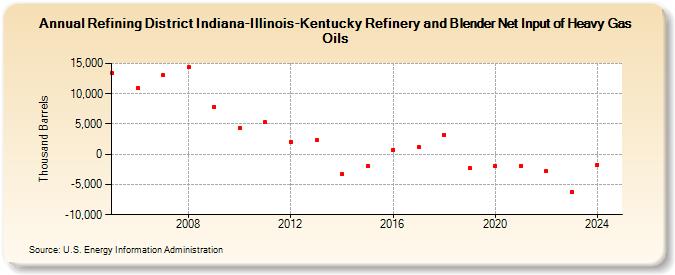
| Refining District Indiana-Illinois-Kentucky Refinery and Blender Net Input of Heavy Gas Oils (Thousand Barrels) | ||||||||
| Decade | Year-0 | Year-1 | Year-2 | Year-3 | Year-4 | Year-5 | Year-6 | Year-7 | Year-8 | Year-9 |
|---|---|---|---|---|---|---|---|---|---|---|
| 2000's | 13,387 | 10,965 | 13,079 | 14,354 | 7,874 | |||||
| 2010's | 4,346 | 5,259 | 2,055 | 2,270 | -3,273 | -1,973 | 724 | 1,234 | 3,221 | -2,289 |
| 2020's | -1,930 | -1,896 | -2,798 | -6,208 |
| - = No Data Reported; -- = Not Applicable; NA = Not Available; W = Withheld to avoid disclosure of individual company data. |
| Release Date: 6/28/2024 |
| Next Release Date: 8/30/2024 |