|
Download Data (XLS File) |
|
||||||||
|
||||||||
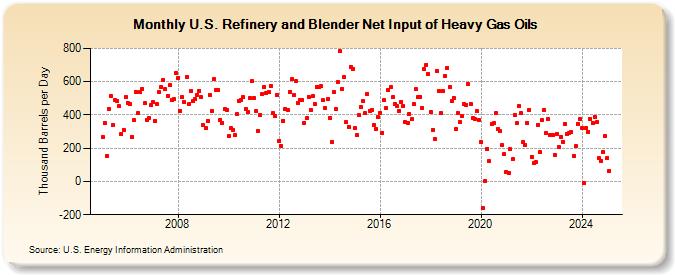
| U.S. Refinery and Blender Net Input of Heavy Gas Oils (Thousand Barrels per Day) | ||||||||
| Year | Jan | Feb | Mar | Apr | May | Jun | Jul | Aug | Sep | Oct | Nov | Dec |
|---|---|---|---|---|---|---|---|---|---|---|---|---|
| 2005 | 266 | 352 | 155 | 438 | 515 | 338 | 488 | 481 | 452 | 284 | 312 | 509 |
| 2006 | 472 | 466 | 269 | 368 | 540 | 411 | 536 | 557 | 470 | 372 | 381 | 457 |
| 2007 | 475 | 366 | 465 | 535 | 567 | 611 | 553 | 514 | 577 | 487 | 494 | 655 |
| 2008 | 624 | 423 | 507 | 476 | 630 | 464 | 546 | 481 | 494 | 522 | 546 | 505 |
| 2009 | 340 | 319 | 365 | 521 | 425 | 613 | 550 | 550 | 371 | 353 | 434 | 430 |
| 2010 | 274 | 319 | 311 | 277 | 404 | 486 | 492 | 505 | 435 | 417 | 502 | 601 |
| 2011 | 501 | 422 | 305 | 400 | 526 | 568 | 532 | 539 | 576 | 410 | 394 | 521 |
| 2012 | 245 | 214 | 366 | 438 | 432 | 540 | 615 | 519 | 605 | 474 | 488 | 490 |
| 2013 | 352 | 379 | 509 | 432 | 511 | 467 | 567 | 566 | 572 | 488 | 443 | 494 |
| 2014 | 384 | 237 | 537 | 438 | 595 | 782 | 558 | 626 | 356 | 330 | 690 | 676 |
| 2015 | 319 | 277 | 397 | 449 | 482 | 411 | 528 | 424 | 430 | 338 | 318 | 385 |
| 2016 | 414 | 293 | 488 | 443 | 547 | 566 | 506 | 467 | 451 | 423 | 478 | 455 |
| 2017 | 356 | 354 | 407 | 373 | 467 | 553 | 506 | 510 | 442 | 674 | 702 | 647 |
| 2018 | 418 | 310 | 257 | 666 | 544 | 411 | 541 | 636 | 685 | 568 | 481 | 502 |
| 2019 | 314 | 413 | 359 | 391 | 463 | 460 | 584 | 467 | 382 | 373 | 421 | 370 |
| 2020 | 240 | -159 | 3 | 197 | 121 | 344 | 349 | 409 | 316 | 301 | 217 | 163 |
| 2021 | 58 | 53 | 194 | 132 | 401 | 349 | 452 | 409 | 236 | 222 | 351 | 431 |
| 2022 | 150 | 110 | 116 | 340 | 175 | 368 | 430 | 292 | 373 | 278 | 282 | 162 |
| 2023 | 288 | 203 | 269 | 240 | 347 | 279 | 291 | 297 | 153 | 211 | 346 | 376 |
| 2024 | 322 | |||||||||||
| - = No Data Reported; -- = Not Applicable; NA = Not Available; W = Withheld to avoid disclosure of individual company data. |
| Release Date: 3/29/2024 |
| Next Release Date: 4/30/2024 |