|
Download Data (XLS File) |
|
||||||||
|
||||||||
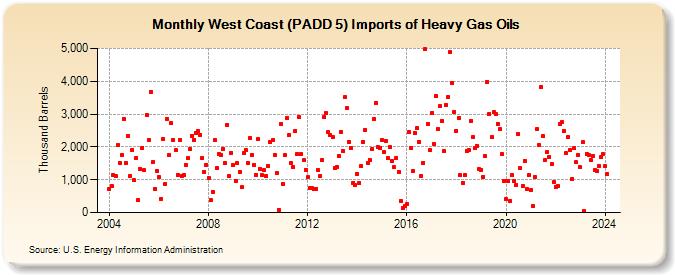
| West Coast (PADD 5) Imports of Heavy Gas Oils (Thousand Barrels) | ||||||||
| Year | Jan | Feb | Mar | Apr | May | Jun | Jul | Aug | Sep | Oct | Nov | Dec |
|---|---|---|---|---|---|---|---|---|---|---|---|---|
| 2004 | 726 | 816 | 1,151 | 1,116 | 2,065 | 1,523 | 1,759 | 2,859 | 1,524 | 2,333 | 1,128 | 1,914 |
| 2005 | 981 | 1,669 | 387 | 1,338 | 1,978 | 1,285 | 2,978 | 2,220 | 3,682 | 1,539 | 732 | 1,268 |
| 2006 | 1,082 | 428 | 2,250 | 873 | 2,854 | 1,750 | 2,720 | 2,208 | 1,893 | 1,150 | 2,199 | 1,109 |
| 2007 | 1,151 | 1,456 | 1,647 | 1,943 | 2,343 | 2,217 | 2,436 | 2,475 | 2,363 | 1,666 | 1,244 | 1,453 |
| 2008 | 1,060 | 376 | 641 | 2,196 | 1,350 | 1,795 | 1,756 | 1,941 | 1,508 | 2,677 | 1,113 | 1,819 |
| 2009 | 1,438 | 968 | 1,497 | 1,236 | 767 | 1,823 | 1,920 | 1,524 | 2,268 | 1,756 | 1,453 | 1,155 |
| 2010 | 2,231 | 1,338 | 1,137 | 1,287 | 1,117 | 1,422 | 2,156 | 2,204 | 1,766 | 1,199 | 84 | 2,692 |
| 2011 | 858 | 1,746 | 2,882 | 2,349 | 1,504 | 1,389 | 2,490 | 1,787 | 2,899 | 1,780 | 1,593 | 1,310 |
| 2012 | 1,072 | 747 | 741 | 709 | 730 | 1,295 | 1,107 | 1,606 | 2,909 | 3,027 | 2,446 | 2,350 |
| 2013 | 2,301 | 1,350 | 1,385 | 1,731 | 2,467 | 1,861 | 3,516 | 3,177 | 2,142 | 1,968 | 909 | 829 |
| 2014 | 1,186 | 894 | 1,412 | 2,149 | 2,518 | 1,507 | 1,613 | 1,923 | 2,850 | 3,330 | 1,994 | 1,977 |
| 2015 | 2,197 | 1,846 | 2,182 | 1,649 | 1,994 | 1,577 | 1,376 | 1,670 | 1,246 | 362 | 152 | 192 |
| 2016 | 264 | 2,441 | 1,975 | 1,268 | 2,421 | 2,571 | 2,146 | 1,114 | 1,523 | 4,968 | 2,684 | 1,900 |
| 2017 | 3,038 | 2,103 | 3,551 | 2,540 | 3,233 | 2,799 | 1,875 | 3,282 | 3,526 | 4,883 | 3,946 | 3,070 |
| 2018 | 2,496 | 2,879 | 1,131 | 915 | 1,140 | 1,884 | 1,894 | 2,798 | 2,301 | 1,975 | 2,038 | 1,315 |
| 2019 | 1,307 | 1,094 | 1,714 | 3,987 | 2,998 | 2,306 | 3,054 | 3,012 | 2,707 | 2,536 | 1,782 | 970 |
| 2020 | 420 | 951 | 357 | 1,138 | 959 | 853 | 2,395 | 1,348 | 815 | 1,582 | 704 | 1,143 |
| 2021 | 698 | 186 | 1,088 | 2,543 | 2,064 | 3,828 | 2,323 | 1,587 | 1,831 | 1,698 | 1,482 | 938 |
| 2022 | 783 | 822 | 2,696 | 2,744 | 2,496 | 1,801 | 2,315 | 1,910 | 1,035 | 1,952 | 1,527 | 1,761 |
| 2023 | 1,375 | 2,134 | 38 | 1,792 | 1,752 | 1,610 | 1,735 | 1,284 | 1,252 | 1,425 | 1,695 | 1,770 |
| 2024 | 1,406 | |||||||||||
| - = No Data Reported; -- = Not Applicable; NA = Not Available; W = Withheld to avoid disclosure of individual company data. |
| Release Date: 3/29/2024 |
| Next Release Date: 4/30/2024 |