|
Download Data (XLS File) |
|
||||||||
|
||||||||
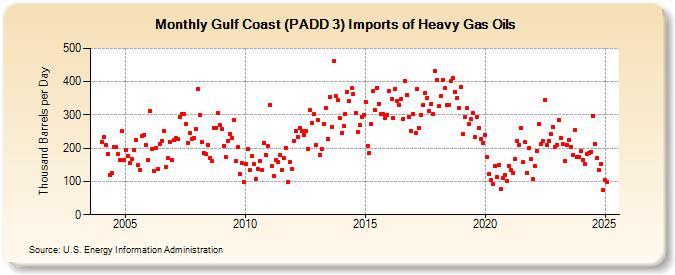
| Gulf Coast (PADD 3) Imports of Heavy Gas Oils (Thousand Barrels per Day) | ||||||||
| Year | Jan | Feb | Mar | Apr | May | Jun | Jul | Aug | Sep | Oct | Nov | Dec |
|---|---|---|---|---|---|---|---|---|---|---|---|---|
| 2004 | 220 | 233 | 210 | 184 | 119 | 125 | 204 | 203 | 182 | 165 | 252 | 163 |
| 2005 | 196 | 176 | 155 | 166 | 195 | 225 | 148 | 133 | 238 | 239 | 210 | 164 |
| 2006 | 313 | 199 | 131 | 200 | 137 | 212 | 223 | 253 | 142 | 170 | 219 | 165 |
| 2007 | 225 | 231 | 229 | 294 | 304 | 303 | 274 | 217 | 247 | 227 | 230 | 258 |
| 2008 | 378 | 301 | 218 | 185 | 182 | 211 | 171 | 160 | 260 | 261 | 307 | 271 |
| 2009 | 258 | 207 | 173 | 222 | 244 | 231 | 286 | 161 | 204 | 123 | 155 | 99 |
| 2010 | 153 | 197 | 135 | 176 | 152 | 108 | 137 | 162 | 133 | 215 | 180 | 206 |
| 2011 | 330 | 146 | 116 | 164 | 158 | 180 | 135 | 170 | 202 | 98 | 158 | 136 |
| 2012 | 222 | 253 | 233 | 262 | 251 | 240 | 252 | 199 | 314 | 276 | 302 | 209 |
| 2013 | 285 | 180 | 197 | 272 | 320 | 228 | 354 | 265 | 461 | 356 | 345 | 292 |
| 2014 | 245 | 266 | 304 | 370 | 342 | 380 | 364 | 306 | 248 | 269 | 294 | 300 |
| 2015 | 340 | 208 | 186 | 273 | 372 | 314 | 382 | 334 | 302 | 303 | 290 | 301 |
| 2016 | 372 | 349 | 292 | 379 | 342 | 331 | 347 | 289 | 401 | 361 | 294 | 253 |
| 2017 | 304 | 247 | 378 | 262 | 301 | 331 | 366 | 352 | 312 | 333 | 303 | 431 |
| 2018 | 405 | 327 | 356 | 406 | 380 | 329 | 330 | 401 | 410 | 369 | 352 | 322 |
| 2019 | 385 | 243 | 295 | 321 | 274 | 287 | 307 | 233 | 294 | 262 | 228 | 216 |
| 2020 | 241 | 172 | 123 | 105 | 92 | 145 | 112 | 150 | 78 | 110 | 119 | 100 |
| 2021 | 147 | 133 | 126 | 166 | 221 | 211 | 262 | 157 | 219 | 126 | 202 | 167 |
| 2022 | 107 | 145 | 191 | 273 | 214 | 223 | 346 | 209 | 223 | 242 | 264 | 203 |
| 2023 | 210 | 285 | 231 | 212 | 160 | 211 | 226 | 203 | 181 | 254 | 174 | 173 |
| 2024 | 191 | |||||||||||
| - = No Data Reported; -- = Not Applicable; NA = Not Available; W = Withheld to avoid disclosure of individual company data. |
| Release Date: 3/29/2024 |
| Next Release Date: 4/30/2024 |