|
Download Data (XLS File) |
|
||||||||
|
||||||||
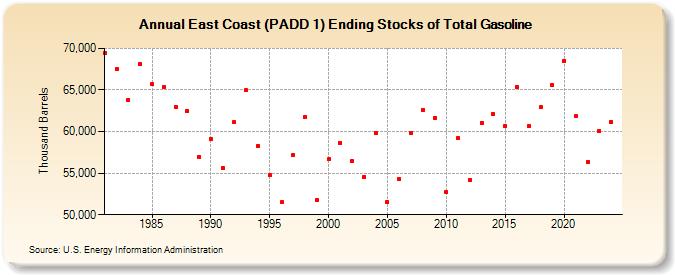
| East Coast (PADD 1) Ending Stocks of Total Gasoline (Thousand Barrels) | ||||||||
| Decade | Year-0 | Year-1 | Year-2 | Year-3 | Year-4 | Year-5 | Year-6 | Year-7 | Year-8 | Year-9 |
|---|---|---|---|---|---|---|---|---|---|---|
| 1980's | 69,503 | 67,496 | 63,820 | 68,121 | 65,665 | 65,335 | 62,974 | 62,462 | 56,944 | |
| 1990's | 59,145 | 55,639 | 61,099 | 64,953 | 58,314 | 54,819 | 51,485 | 57,183 | 61,727 | 51,724 |
| 2000's | 56,668 | 58,681 | 56,451 | 54,580 | 59,817 | 51,554 | 54,277 | 59,858 | 62,625 | 61,681 |
| 2010's | 52,736 | 59,205 | 54,207 | 61,079 | 62,085 | 60,722 | 65,379 | 60,642 | 62,894 | 65,614 |
| 2020's | 68,522 | 61,830 | 56,398 | 60,106 |
| - = No Data Reported; -- = Not Applicable; NA = Not Available; W = Withheld to avoid disclosure of individual company data. |
| Release Date: 6/28/2024 |
| Next Release Date: 8/30/2024 |