|
Download Data (XLS File) |
|
||||||||
|
||||||||
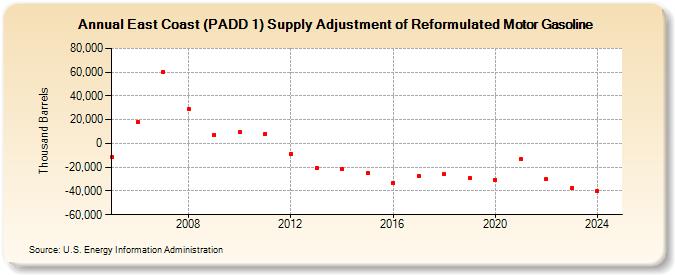
| East Coast (PADD 1) Supply Adjustment of Reformulated Motor Gasoline (Thousand Barrels) | ||||||||
| Decade | Year-0 | Year-1 | Year-2 | Year-3 | Year-4 | Year-5 | Year-6 | Year-7 | Year-8 | Year-9 |
|---|---|---|---|---|---|---|---|---|---|---|
| 2000's | -11,615 | 18,252 | 60,437 | 29,099 | 7,371 | |||||
| 2010's | 9,520 | 8,360 | -8,597 | -20,764 | -21,266 | -24,817 | -33,032 | -27,097 | -25,996 | -29,181 |
| 2020's | -30,636 | -13,184 | -30,202 | -39,381 |
| - = No Data Reported; -- = Not Applicable; NA = Not Available; W = Withheld to avoid disclosure of individual company data. |
| Release Date: 3/29/2024 |
| Next Release Date: 8/30/2024 |