|
Download Data (XLS File) |
|
||||||||
|
||||||||
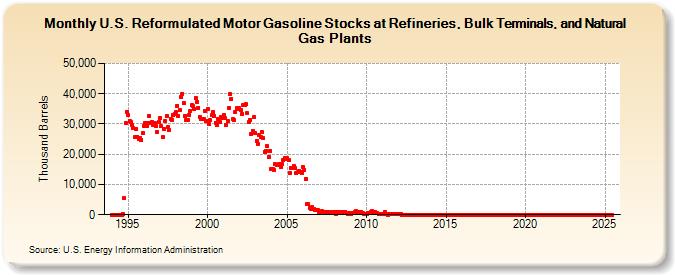
| U.S. Reformulated Motor Gasoline Stocks at Refineries, Bulk Terminals, and Natural Gas Plants (Thousand Barrels) | ||||||||
| Year | Jan | Feb | Mar | Apr | May | Jun | Jul | Aug | Sep | Oct | Nov | Dec |
|---|---|---|---|---|---|---|---|---|---|---|---|---|
| 1994 | 0 | 0 | 0 | 0 | 0 | 0 | 0 | 0 | 354 | 5,378 | 30,175 | 34,046 |
| 1995 | 33,034 | 30,967 | 30,666 | 29,769 | 28,712 | 25,673 | 28,293 | 25,841 | 24,886 | 25,352 | 24,865 | 27,144 |
| 1996 | 29,423 | 30,262 | 29,325 | 30,220 | 32,784 | 30,470 | 30,766 | 29,557 | 30,214 | 29,411 | 27,476 | 30,729 |
| 1997 | 31,944 | 29,200 | 25,621 | 28,347 | 30,845 | 32,624 | 29,037 | 28,050 | 31,691 | 31,435 | 32,948 | 33,374 |
| 1998 | 33,945 | 36,034 | 32,771 | 34,585 | 38,853 | 40,052 | 36,856 | 32,723 | 31,227 | 31,432 | 33,031 | 34,362 |
| 1999 | 36,349 | 35,881 | 35,073 | 38,552 | 37,284 | 35,376 | 32,404 | 31,661 | 31,578 | 31,731 | 34,379 | 31,115 |
| 2000 | 34,837 | 30,140 | 31,180 | 32,997 | 33,800 | 32,756 | 30,442 | 29,639 | 31,653 | 30,735 | 32,366 | 31,989 |
| 2001 | 32,893 | 31,848 | 29,747 | 30,886 | 35,378 | 39,850 | 38,255 | 31,608 | 31,263 | 33,936 | 35,146 | 34,866 |
| 2002 | 35,153 | 34,459 | 33,441 | 36,266 | 36,270 | 36,455 | 33,528 | 30,686 | 31,349 | 26,737 | 27,758 | 32,257 |
| 2003 | 27,038 | 24,377 | 23,454 | 26,461 | 25,774 | 27,308 | 25,320 | 20,849 | 21,129 | 22,600 | 19,136 | 21,101 |
| 2004 | 15,047 | 15,061 | 14,918 | 16,735 | 16,594 | 16,565 | 16,699 | 15,676 | 16,889 | 18,141 | 18,730 | 18,533 |
| 2005 | 18,600 | 17,936 | 13,948 | 15,542 | 15,485 | 16,054 | 15,444 | 13,707 | 14,022 | 14,616 | 14,263 | 13,860 |
| 2006 | 15,759 | 14,836 | 11,883 | 3,471 | 3,430 | 2,322 | 1,999 | 2,397 | 1,985 | 1,423 | 1,435 | 1,566 |
| 2007 | 1,043 | 876 | 1,220 | 987 | 1,009 | 990 | 962 | 971 | 793 | 741 | 552 | 810 |
| 2008 | 517 | 272 | 868 | 960 | 804 | 914 | 909 | 976 | 980 | 726 | 327 | 495 |
| 2009 | 329 | 720 | 587 | 951 | 1,063 | 1,017 | 767 | 564 | 789 | 405 | 358 | 364 |
| 2010 | 399 | 410 | 715 | 894 | 1,070 | 701 | 828 | 611 | 439 | 204 | 178 | 255 |
| 2011 | 364 | 210 | 749 | 300 | 67 | 103 | 109 | 167 | 170 | 119 | 177 | 175 |
| 2012 | 260 | 266 | 273 | 36 | 39 | 31 | 20 | 45 | 38 | 26 | 19 | 43 |
| 2013 | 29 | 23 | 38 | 34 | 44 | 28 | 29 | 32 | 43 | 40 | 41 | 48 |
| 2014 | 39 | 43 | 45 | 43 | 42 | 42 | 38 | 45 | 47 | 36 | 42 | 38 |
| 2015 | 38 | 31 | 34 | 39 | 27 | 44 | 32 | 31 | 39 | 39 | 46 | 30 |
| 2016 | 37 | 40 | 32 | 32 | 50 | 43 | 44 | 48 | 47 | 43 | 44 | 47 |
| 2017 | 55 | 55 | 45 | 46 | 46 | 50 | 53 | 47 | 43 | 44 | 47 | 40 |
| 2018 | 48 | 45 | 45 | 34 | 36 | 56 | 49 | 44 | 52 | 52 | 47 | 44 |
| 2019 | 46 | 31 | 44 | 39 | 46 | 34 | 48 | 52 | 49 | 40 | 48 | 41 |
| 2020 | 50 | 46 | 51 | 50 | 48 | 44 | 53 | 47 | 44 | 52 | 52 | 48 |
| 2021 | 38 | 45 | 24 | 22 | 24 | 22 | 19 | 23 | 26 | 25 | 20 | 22 |
| 2022 | 18 | 19 | 31 | 29 | 31 | 32 | 22 | 23 | 26 | 28 | 23 | 20 |
| 2023 | 23 | 22 | 21 | 26 | 22 | 24 | 19 | 15 | 20 | 22 | 22 | 22 |
| 2024 | 19 | 18 | 22 | 20 | ||||||||
| - = No Data Reported; -- = Not Applicable; NA = Not Available; W = Withheld to avoid disclosure of individual company data. |
| Release Date: 6/28/2024 |
| Next Release Date: 7/31/2024 |