|
Download Data (XLS File) |
|
||||||||
|
||||||||
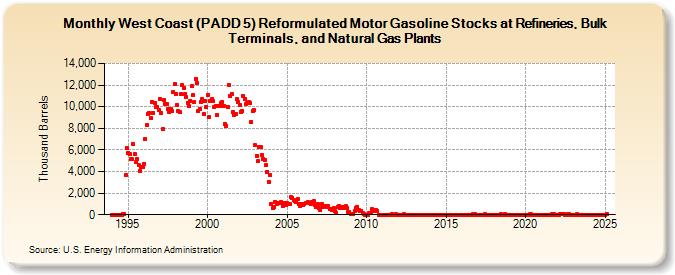
| West Coast (PADD 5) Reformulated Motor Gasoline Stocks at Refineries, Bulk Terminals, and Natural Gas Plants (Thousand Barrels) | ||||||||
| Year | Jan | Feb | Mar | Apr | May | Jun | Jul | Aug | Sep | Oct | Nov | Dec |
|---|---|---|---|---|---|---|---|---|---|---|---|---|
| 1994 | 0 | 0 | 0 | 0 | 0 | 0 | 0 | 0 | 82 | 100 | 3,698 | 6,180 |
| 1995 | 5,721 | 5,636 | 5,114 | 5,115 | 6,529 | 5,607 | 4,847 | 5,157 | 4,560 | 4,083 | 4,406 | 4,415 |
| 1996 | 4,734 | 7,014 | 8,295 | 9,363 | 9,455 | 8,945 | 10,465 | 9,462 | 10,379 | 9,931 | 9,987 | 9,654 |
| 1997 | 10,744 | 9,394 | 7,907 | 10,584 | 10,258 | 10,219 | 9,780 | 9,502 | 9,804 | 9,647 | 11,336 | 12,068 |
| 1998 | 11,202 | 10,192 | 9,556 | 9,481 | 11,164 | 11,988 | 11,718 | 11,129 | 10,880 | 10,356 | 10,030 | 10,539 |
| 1999 | 11,890 | 11,068 | 10,429 | 12,605 | 12,194 | 9,606 | 9,740 | 10,439 | 10,697 | 9,346 | 10,513 | 10,001 |
| 2000 | 11,107 | 9,068 | 10,570 | 10,666 | 10,486 | 9,951 | 10,080 | 9,240 | 10,023 | 10,029 | 10,313 | 10,436 |
| 2001 | 10,107 | 8,362 | 8,236 | 10,016 | 12,050 | 11,022 | 11,185 | 9,497 | 9,219 | 9,288 | 10,676 | 10,438 |
| 2002 | 10,129 | 9,547 | 9,587 | 10,972 | 10,745 | 10,234 | 10,329 | 10,437 | 10,331 | 8,611 | 9,638 | 9,681 |
| 2003 | 6,411 | 5,437 | 4,954 | 6,304 | 6,278 | 5,524 | 5,158 | 5,054 | 4,573 | 4,000 | 3,032 | 3,668 |
| 2004 | 984 | 632 | 693 | 1,197 | 1,008 | 1,119 | 1,046 | 1,144 | 1,099 | 853 | 1,073 | 871 |
| 2005 | 1,073 | 947 | 960 | 1,600 | 1,585 | 1,389 | 1,226 | 1,158 | 1,424 | 954 | 792 | 1,009 |
| 2006 | 928 | 1,034 | 1,068 | 1,095 | 1,133 | 1,078 | 1,034 | 1,206 | 1,239 | 873 | 751 | 988 |
| 2007 | 651 | 460 | 1,006 | 754 | 781 | 811 | 723 | 767 | 567 | 561 | 396 | 607 |
| 2008 | 350 | 168 | 733 | 807 | 598 | 725 | 657 | 745 | 777 | 625 | 223 | 241 |
| 2009 | 20 | 21 | 107 | 360 | 624 | 758 | 415 | 320 | 385 | 137 | 68 | 18 |
| 2010 | 18 | 15 | 134 | 190 | 501 | 434 | 346 | 464 | 338 | 17 | 19 | 14 |
| 2011 | 15 | 16 | 12 | 12 | 14 | 14 | 17 | 20 | 18 | 19 | 21 | 11 |
| 2012 | 16 | 17 | 13 | 17 | 20 | 19 | 14 | 16 | 17 | 16 | 12 | 15 |
| 2013 | 14 | 15 | 18 | 17 | 16 | 10 | 13 | 17 | 16 | 15 | 17 | 17 |
| 2014 | 10 | 14 | 15 | 15 | 15 | 17 | 14 | 17 | 15 | 11 | 13 | 12 |
| 2015 | 15 | 15 | 13 | 16 | 11 | 14 | 14 | 13 | 18 | 15 | 18 | 14 |
| 2016 | 19 | 13 | 10 | 17 | 19 | 19 | 18 | 18 | 21 | 18 | 20 | 16 |
| 2017 | 16 | 18 | 12 | 17 | 13 | 20 | 19 | 15 | 19 | 16 | 17 | 16 |
| 2018 | 16 | 17 | 16 | 17 | 18 | 20 | 18 | 19 | 20 | 17 | 18 | 14 |
| 2019 | 15 | 17 | 18 | 18 | 19 | 17 | 18 | 19 | 13 | 16 | 13 | 13 |
| 2020 | 18 | 13 | 12 | 21 | 22 | 18 | 18 | 16 | 16 | 18 | 18 | 18 |
| 2021 | 15 | 17 | 18 | 16 | 18 | 16 | 14 | 18 | 20 | 20 | 14 | 16 |
| 2022 | 14 | 14 | 26 | 25 | 27 | 27 | 18 | 18 | 20 | 22 | 17 | 15 |
| 2023 | 18 | 16 | 16 | 20 | 16 | 15 | 16 | 10 | 16 | 17 | 17 | 17 |
| 2024 | 14 | |||||||||||
| - = No Data Reported; -- = Not Applicable; NA = Not Available; W = Withheld to avoid disclosure of individual company data. |
| Release Date: 3/29/2024 |
| Next Release Date: 4/30/2024 |