|
Download Data (XLS File) |
|
||||||||
|
||||||||
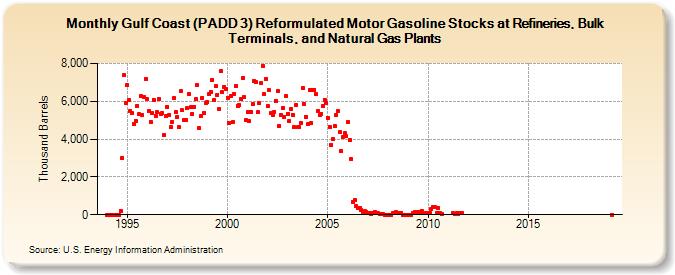
| Gulf Coast (PADD 3) Reformulated Motor Gasoline Stocks at Refineries, Bulk Terminals, and Natural Gas Plants (Thousand Barrels) | ||||||||
| Year | Jan | Feb | Mar | Apr | May | Jun | Jul | Aug | Sep | Oct | Nov | Dec |
|---|---|---|---|---|---|---|---|---|---|---|---|---|
| 1994 | 0 | 0 | 0 | 0 | 0 | 0 | 0 | 0 | 202 | 3,012 | 7,365 | 5,897 |
| 1995 | 6,857 | 6,071 | 5,470 | 5,397 | 4,820 | 4,965 | 5,758 | 5,311 | 6,270 | 5,279 | 6,246 | 7,186 |
| 1996 | 6,106 | 5,486 | 4,907 | 5,364 | 6,078 | 5,239 | 5,409 | 6,124 | 5,351 | 5,371 | 4,198 | 5,205 |
| 1997 | 5,718 | 5,276 | 4,654 | 4,893 | 6,183 | 5,433 | 5,180 | 4,616 | 6,536 | 5,513 | 5,021 | 5,033 |
| 1998 | 5,624 | 6,371 | 5,683 | 5,351 | 5,699 | 6,113 | 6,846 | 4,577 | 5,213 | 6,196 | 5,396 | 5,926 |
| 1999 | 5,947 | 6,373 | 6,511 | 7,146 | 6,074 | 6,805 | 6,346 | 5,580 | 7,576 | 6,468 | 6,767 | 6,665 |
| 2000 | 6,193 | 4,859 | 6,285 | 4,894 | 6,398 | 6,819 | 5,776 | 5,791 | 6,130 | 7,227 | 6,233 | 4,999 |
| 2001 | 5,446 | 4,949 | 5,439 | 5,881 | 7,081 | 7,008 | 5,414 | 5,896 | 6,944 | 7,882 | 6,375 | 7,182 |
| 2002 | 5,762 | 6,578 | 5,373 | 5,291 | 5,449 | 6,016 | 6,537 | 4,693 | 5,292 | 5,664 | 5,180 | 6,276 |
| 2003 | 5,350 | 4,946 | 5,580 | 5,296 | 4,621 | 5,816 | 4,639 | 4,647 | 4,872 | 6,708 | 5,832 | 5,183 |
| 2004 | 4,797 | 6,609 | 4,834 | 6,574 | 6,614 | 6,367 | 5,477 | 5,263 | 5,343 | 5,733 | 6,092 | 5,922 |
| 2005 | 5,142 | 4,630 | 3,709 | 3,982 | 4,671 | 5,275 | 5,464 | 4,367 | 3,365 | 4,129 | 4,302 | 4,138 |
| 2006 | 4,891 | 3,932 | 2,943 | 694 | 752 | 438 | 371 | 371 | 255 | 147 | 176 | 153 |
| 2007 | 108 | 117 | 17 | 111 | 133 | 90 | 87 | 42 | 15 | 12 | 8 | 9 |
| 2008 | 7 | 6 | 6 | 85 | 85 | 134 | 117 | 114 | 115 | 8 | 8 | 8 |
| 2009 | 1 | 1 | 1 | 84 | 119 | 83 | 161 | 135 | 215 | 83 | 113 | 100 |
| 2010 | 100 | 100 | 304 | 422 | 389 | 90 | 354 | 97 | 23 | |||
| 2011 | 70 | 30 | 75 | 55 | 103 | 66 | ||||||
| 2012 | 55 | 82 | 89 | 113 | 95 | 25 | ||||||
| 2019 | 0 | |||||||||||
| - = No Data Reported; -- = Not Applicable; NA = Not Available; W = Withheld to avoid disclosure of individual company data. |
| Release Date: 3/29/2024 |
| Next Release Date: 4/30/2024 |