|
Download Data (XLS File) |
|
||||||||
|
||||||||
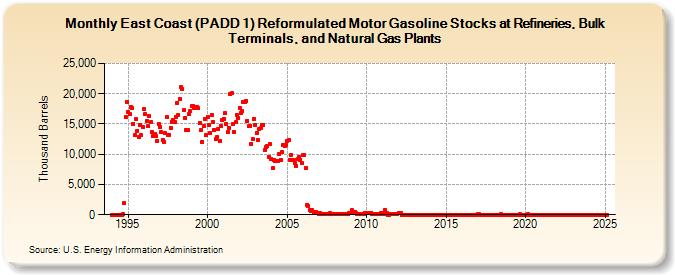
| East Coast (PADD 1) Reformulated Motor Gasoline Stocks at Refineries, Bulk Terminals, and Natural Gas Plants (Thousand Barrels) | ||||||||
| Year | Jan | Feb | Mar | Apr | May | Jun | Jul | Aug | Sep | Oct | Nov | Dec |
|---|---|---|---|---|---|---|---|---|---|---|---|---|
| 1994 | 0 | 0 | 0 | 0 | 0 | 0 | 0 | 0 | 70 | 1,925 | 16,123 | 18,611 |
| 1995 | 17,003 | 16,584 | 17,867 | 17,571 | 15,007 | 13,107 | 15,883 | 13,887 | 12,905 | 14,788 | 13,106 | 14,480 |
| 1996 | 17,518 | 16,603 | 15,505 | 14,621 | 16,331 | 15,275 | 13,658 | 12,992 | 13,288 | 13,053 | 12,241 | 14,938 |
| 1997 | 14,485 | 13,671 | 12,359 | 12,087 | 13,433 | 16,091 | 13,224 | 13,259 | 14,387 | 15,367 | 15,674 | 15,323 |
| 1998 | 16,226 | 18,543 | 16,543 | 19,186 | 21,146 | 20,838 | 17,343 | 16,066 | 14,015 | 13,942 | 16,635 | 17,071 |
| 1999 | 17,907 | 17,991 | 17,619 | 17,834 | 17,887 | 17,565 | 15,164 | 13,990 | 12,064 | 14,705 | 15,753 | 13,157 |
| 2000 | 16,086 | 14,804 | 13,477 | 16,495 | 15,269 | 14,066 | 12,481 | 12,879 | 14,220 | 12,168 | 14,707 | 15,631 |
| 2001 | 15,878 | 16,749 | 14,958 | 13,667 | 14,381 | 20,017 | 20,040 | 15,021 | 13,732 | 15,247 | 16,502 | 15,989 |
| 2002 | 17,719 | 16,875 | 17,127 | 18,627 | 18,630 | 18,840 | 15,566 | 14,618 | 14,728 | 11,762 | 12,438 | 15,868 |
| 2003 | 14,880 | 13,574 | 12,395 | 14,208 | 14,316 | 14,860 | 14,900 | 10,696 | 11,160 | 11,296 | 9,615 | 11,687 |
| 2004 | 9,194 | 7,657 | 9,118 | 8,856 | 8,871 | 8,857 | 10,033 | 9,051 | 10,289 | 11,487 | 11,345 | 11,569 |
| 2005 | 12,255 | 12,271 | 9,091 | 9,909 | 8,992 | 9,117 | 8,543 | 8,053 | 9,183 | 9,489 | 9,089 | 8,614 |
| 2006 | 9,878 | 9,838 | 7,803 | 1,659 | 1,484 | 777 | 566 | 745 | 442 | 347 | 390 | 346 |
| 2007 | 197 | 203 | 196 | 120 | 88 | 85 | 148 | 154 | 205 | 161 | 142 | 186 |
| 2008 | 160 | 98 | 129 | 68 | 121 | 55 | 135 | 117 | 88 | 93 | 96 | 246 |
| 2009 | 308 | 698 | 479 | 507 | 320 | 176 | 191 | 109 | 189 | 185 | 177 | 246 |
| 2010 | 281 | 295 | 277 | 282 | 180 | 177 | 128 | 50 | 78 | 187 | 159 | 241 |
| 2011 | 349 | 194 | 737 | 218 | 23 | 14 | 37 | 44 | 86 | 100 | 156 | 164 |
| 2012 | 244 | 249 | 260 | 19 | 19 | 12 | 6 | 29 | 21 | 10 | 7 | 28 |
| 2013 | 15 | 8 | 20 | 17 | 28 | 18 | 16 | 15 | 27 | 25 | 24 | 31 |
| 2014 | 29 | 29 | 30 | 28 | 27 | 25 | 24 | 28 | 32 | 25 | 29 | 26 |
| 2015 | 23 | 16 | 21 | 23 | 16 | 30 | 18 | 18 | 21 | 24 | 28 | 16 |
| 2016 | 18 | 27 | 22 | 15 | 31 | 24 | 26 | 30 | 26 | 25 | 24 | 31 |
| 2017 | 39 | 37 | 33 | 29 | 33 | 30 | 34 | 32 | 24 | 28 | 30 | 24 |
| 2018 | 32 | 28 | 29 | 17 | 18 | 36 | 31 | 25 | 32 | 35 | 29 | 30 |
| 2019 | 31 | 14 | 26 | 21 | 27 | 17 | 30 | 33 | 36 | 24 | 35 | 28 |
| 2020 | 32 | 33 | 39 | 29 | 26 | 26 | 35 | 31 | 28 | 34 | 34 | 30 |
| 2021 | 23 | 28 | 6 | 6 | 6 | 6 | 5 | 5 | 6 | 5 | 6 | 6 |
| 2022 | 4 | 5 | 5 | 4 | 4 | 5 | 4 | 4 | 5 | 5 | 5 | 5 |
| 2023 | 5 | 5 | 4 | 5 | 5 | 4 | 3 | 5 | 4 | 5 | 5 | 5 |
| 2024 | 5 | |||||||||||
| - = No Data Reported; -- = Not Applicable; NA = Not Available; W = Withheld to avoid disclosure of individual company data. |
| Release Date: 3/29/2024 |
| Next Release Date: 4/30/2024 |