|
Download Data (XLS File) |
|
||||||||
|
||||||||
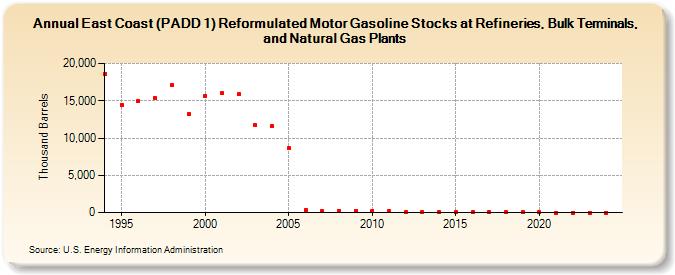
| East Coast (PADD 1) Reformulated Motor Gasoline Stocks at Refineries, Bulk Terminals, and Natural Gas Plants (Thousand Barrels) | ||||||||
| Decade | Year-0 | Year-1 | Year-2 | Year-3 | Year-4 | Year-5 | Year-6 | Year-7 | Year-8 | Year-9 |
|---|---|---|---|---|---|---|---|---|---|---|
| 1990's | 18,611 | 14,480 | 14,938 | 15,323 | 17,071 | 13,157 | ||||
| 2000's | 15,631 | 15,989 | 15,868 | 11,687 | 11,569 | 8,614 | 346 | 186 | 246 | 246 |
| 2010's | 241 | 164 | 28 | 31 | 26 | 16 | 31 | 24 | 30 | 28 |
| 2020's | 30 | 6 | 5 | 5 |
| - = No Data Reported; -- = Not Applicable; NA = Not Available; W = Withheld to avoid disclosure of individual company data. |
| Release Date: 3/29/2024 |
| Next Release Date: 8/30/2024 |