|
Download Data (XLS File) |
|
||||||||
|
||||||||
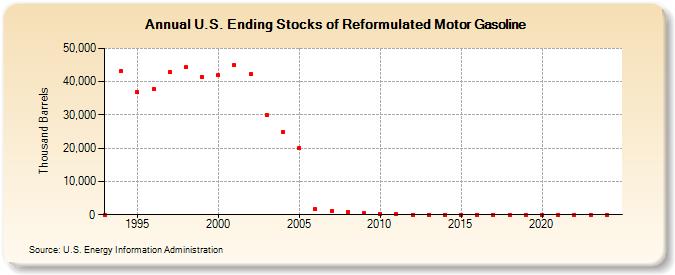
| U.S. Ending Stocks of Reformulated Motor Gasoline (Thousand Barrels) | ||||||||
| Decade | Year-0 | Year-1 | Year-2 | Year-3 | Year-4 | Year-5 | Year-6 | Year-7 | Year-8 | Year-9 |
|---|---|---|---|---|---|---|---|---|---|---|
| 1990's | 0 | 43,125 | 36,797 | 37,831 | 42,931 | 44,264 | 41,437 | |||
| 2000's | 41,885 | 44,918 | 42,161 | 30,006 | 24,802 | 20,037 | 1,601 | 1,224 | 869 | 383 |
| 2010's | 255 | 202 | 43 | 48 | 38 | 30 | 47 | 40 | 44 | 41 |
| 2020's | 48 | 22 | 20 | 22 |
| - = No Data Reported; -- = Not Applicable; NA = Not Available; W = Withheld to avoid disclosure of individual company data. |
| Release Date: 3/29/2024 |
| Next Release Date: 8/30/2024 |