|
Download Data (XLS File) |
|
||||||||
|
||||||||
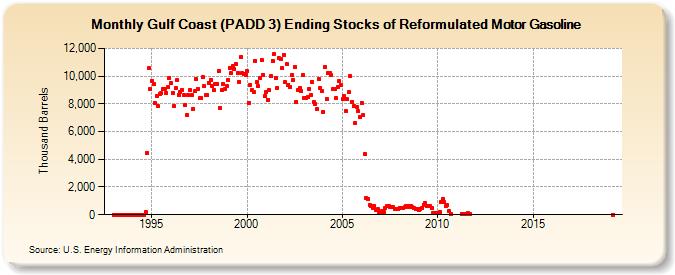
| Gulf Coast (PADD 3) Ending Stocks of Reformulated Motor Gasoline (Thousand Barrels) | ||||||||
| Year | Jan | Feb | Mar | Apr | May | Jun | Jul | Aug | Sep | Oct | Nov | Dec |
|---|---|---|---|---|---|---|---|---|---|---|---|---|
| 1993 | 0 | 0 | 0 | 0 | 0 | 0 | 0 | 0 | 0 | 0 | 0 | 0 |
| 1994 | 0 | 0 | 0 | 0 | 0 | 0 | 0 | 0 | 202 | 4,485 | 10,559 | 9,059 |
| 1995 | 9,666 | 9,409 | 8,055 | 8,578 | 7,819 | 8,686 | 8,754 | 9,053 | 9,083 | 8,784 | 9,191 | 9,853 |
| 1996 | 9,474 | 8,815 | 7,832 | 9,150 | 9,697 | 8,662 | 8,825 | 9,009 | 8,613 | 7,929 | 7,213 | 8,650 |
| 1997 | 8,983 | 8,610 | 7,652 | 8,906 | 9,765 | 9,100 | 8,397 | 8,418 | 9,917 | 9,286 | 8,606 | 8,632 |
| 1998 | 9,529 | 9,753 | 9,264 | 8,992 | 9,424 | 9,436 | 10,362 | 7,691 | 8,979 | 9,464 | 9,057 | 9,277 |
| 1999 | 9,730 | 10,594 | 10,196 | 10,726 | 10,487 | 10,877 | 10,242 | 9,583 | 11,372 | 10,196 | 10,154 | 10,059 |
| 2000 | 10,351 | 8,071 | 9,373 | 8,963 | 8,860 | 11,123 | 9,579 | 9,285 | 9,835 | 11,152 | 10,104 | 8,564 |
| 2001 | 8,863 | 8,304 | 8,976 | 9,972 | 11,125 | 11,612 | 9,878 | 9,172 | 11,282 | 11,227 | 10,570 | 11,546 |
| 2002 | 9,543 | 10,845 | 9,392 | 9,198 | 10,091 | 9,717 | 10,662 | 8,149 | 9,002 | 9,133 | 8,896 | 10,072 |
| 2003 | 8,405 | 8,451 | 8,473 | 9,096 | 8,642 | 9,609 | 8,148 | 7,990 | 7,641 | 9,766 | 9,136 | 8,943 |
| 2004 | 7,445 | 10,681 | 8,355 | 10,198 | 10,198 | 10,049 | 9,038 | 9,067 | 8,399 | 9,234 | 9,623 | 9,363 |
| 2005 | 8,348 | 8,554 | 7,455 | 8,327 | 8,833 | 10,002 | 8,161 | 7,843 | 6,643 | 7,762 | 7,462 | 7,043 |
| 2006 | 8,066 | 7,168 | 4,371 | 1,202 | 1,136 | 684 | 615 | 520 | 646 | 344 | 386 | 153 |
| 2007 | 108 | 237 | 220 | 491 | 619 | 639 | 563 | 541 | 571 | 423 | 394 | 423 |
| 2008 | 503 | 494 | 454 | 529 | 629 | 595 | 573 | 622 | 524 | 462 | 420 | 382 |
| 2009 | 370 | 445 | 482 | 712 | 832 | 626 | 646 | 607 | 478 | 117 | 113 | 100 |
| 2010 | 100 | 216 | 916 | 1,138 | 899 | 639 | 676 | 261 | 23 | |||
| 2011 | 70 | 30 | 75 | 55 | 103 | 66 | ||||||
| 2012 | 55 | 82 | 89 | 113 | 95 | 25 | ||||||
| 2019 | 0 | |||||||||||
| - = No Data Reported; -- = Not Applicable; NA = Not Available; W = Withheld to avoid disclosure of individual company data. |
| Release Date: 6/28/2024 |
| Next Release Date: 7/31/2024 |