|
Download Data (XLS File) |
|
||||||||
|
||||||||
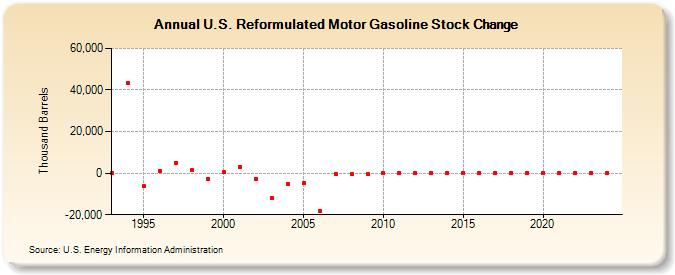
| U.S. Reformulated Motor Gasoline Stock Change (Thousand Barrels) | ||||||||
| Decade | Year-0 | Year-1 | Year-2 | Year-3 | Year-4 | Year-5 | Year-6 | Year-7 | Year-8 | Year-9 |
|---|---|---|---|---|---|---|---|---|---|---|
| 1990's | 0 | 43,125 | -6,328 | 1,034 | 5,100 | 1,333 | -2,827 | |||
| 2000's | 448 | 3,033 | -2,757 | -12,155 | -5,204 | -4,765 | -18,436 | -377 | -355 | -486 |
| 2010's | -128 | -53 | -159 | 5 | -10 | -8 | 17 | -7 | 4 | -3 |
| 2020's | 7 | -26 | -2 | 2 | -1 |
| - = No Data Reported; -- = Not Applicable; NA = Not Available; W = Withheld to avoid disclosure of individual company data. |
| Release Date: 6/30/2025 |
| Next Release Date: 8/29/2025 |
Referring Pages: