|
Download Data (XLS File) |
|
||||||||
|
||||||||
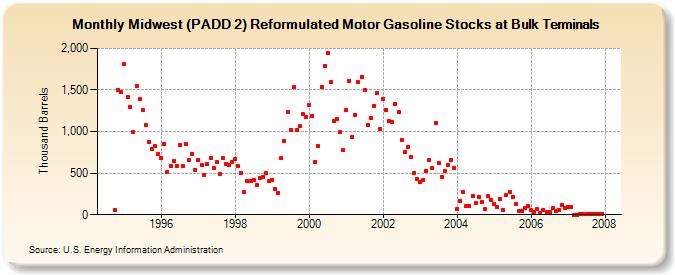
| Midwest (PADD 2) Reformulated Motor Gasoline Stocks at Bulk Terminals (Thousand Barrels) | ||||||||
| Year | Jan | Feb | Mar | Apr | May | Jun | Jul | Aug | Sep | Oct | Nov | Dec |
|---|---|---|---|---|---|---|---|---|---|---|---|---|
| 1994 | 57 | 1,499 | 1,471 | |||||||||
| 1995 | 1,807 | 1,410 | 1,293 | 993 | 1,550 | 1,387 | 1,264 | 1,073 | 879 | 795 | 824 | 732 |
| 1996 | 684 | 852 | 518 | 590 | 647 | 586 | 834 | 583 | 847 | 659 | 733 | 543 |
| 1997 | 658 | 596 | 480 | 607 | 686 | 556 | 629 | 489 | 683 | 605 | 592 | 639 |
| 1998 | 664 | 585 | 505 | 279 | 408 | 407 | 412 | 359 | 446 | 458 | 499 | 404 |
| 1999 | 423 | 308 | 261 | 680 | 892 | 1,236 | 1,018 | 1,531 | 1,017 | 1,063 | 1,208 | 1,179 |
| 2000 | 1,316 | 1,192 | 638 | 822 | 1,530 | 1,790 | 1,944 | 1,593 | 1,128 | 1,150 | 991 | 783 |
| 2001 | 1,264 | 1,612 | 939 | 1,200 | 1,592 | 1,656 | 1,497 | 1,077 | 1,165 | 1,311 | 1,461 | 1,025 |
| 2002 | 1,395 | 1,262 | 1,126 | 1,110 | 1,332 | 1,237 | 901 | 753 | 818 | 700 | 502 | 432 |
| 2003 | 397 | 420 | 525 | 653 | 559 | 1,108 | 623 | 452 | 524 | 596 | 657 | 563 |
| 2004 | 72 | 163 | 273 | 108 | 101 | 222 | 143 | 218 | 158 | 68 | 220 | 171 |
| 2005 | 130 | 88 | 188 | 51 | 237 | 273 | 211 | 129 | 50 | 44 | 80 | 99 |
| 2006 | 62 | 32 | 69 | 23 | 61 | 29 | 28 | 75 | 49 | 56 | 118 | 79 |
| 2007 | 87 | 96 | 1 | 2 | 7 | 4 | 4 | 8 | 6 | 7 | 6 | 8 |
| - = No Data Reported; -- = Not Applicable; NA = Not Available; W = Withheld to avoid disclosure of individual company data. |
| Release Date: 3/29/2024 |
| Next Release Date: 4/30/2024 |