|
Download Data (XLS File) |
|
||||||||
|
||||||||
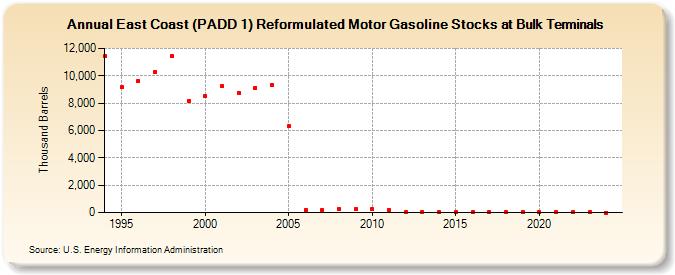
| East Coast (PADD 1) Reformulated Motor Gasoline Stocks at Bulk Terminals (Thousand Barrels) | ||||||||
| Decade | Year-0 | Year-1 | Year-2 | Year-3 | Year-4 | Year-5 | Year-6 | Year-7 | Year-8 | Year-9 |
|---|---|---|---|---|---|---|---|---|---|---|
| 1990's | 11,457 | 9,150 | 9,628 | 10,285 | 11,434 | 8,155 | ||||
| 2000's | 8,504 | 9,233 | 8,751 | 9,126 | 9,295 | 6,303 | 201 | 186 | 246 | 246 |
| 2010's | 241 | 164 | 28 | 31 | 26 | 16 | 31 | 24 | 30 | 28 |
| 2020's | 30 | 6 | 5 | 5 |
| - = No Data Reported; -- = Not Applicable; NA = Not Available; W = Withheld to avoid disclosure of individual company data. |
| Release Date: 6/28/2024 |
| Next Release Date: 8/30/2024 |