|
Download Data (XLS File) |
|
||||||||
|
||||||||
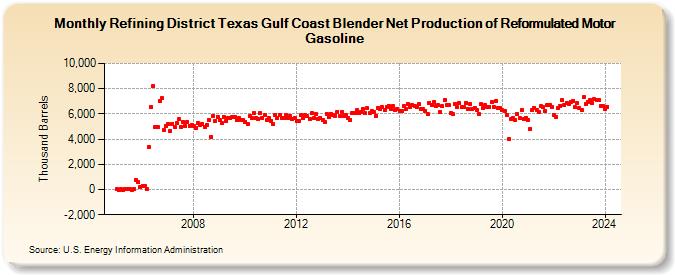
| Refining District Texas Gulf Coast Blender Net Production of Reformulated Motor Gasoline (Thousand Barrels) | ||||||||
| Year | Jan | Feb | Mar | Apr | May | Jun | Jul | Aug | Sep | Oct | Nov | Dec |
|---|---|---|---|---|---|---|---|---|---|---|---|---|
| 2005 | 6 | 0 | 28 | -21 | 66 | 13 | 46 | -4 | 1 | 765 | 571 | 195 |
| 2006 | 300 | 265 | 10 | 3,374 | 6,534 | 8,209 | 4,922 | 4,935 | 7,049 | 7,246 | 4,699 | 5,019 |
| 2007 | 5,194 | 4,660 | 5,221 | 4,966 | 5,270 | 5,568 | 4,969 | 5,358 | 5,058 | 5,372 | 5,040 | 5,148 |
| 2008 | 5,003 | 4,871 | 5,239 | 5,125 | 5,189 | 4,997 | 5,155 | 5,524 | 4,189 | 5,858 | 5,451 | 5,775 |
| 2009 | 5,531 | 5,276 | 5,779 | 5,422 | 5,698 | 5,698 | 5,734 | 5,778 | 5,485 | 5,668 | 5,482 | 5,530 |
| 2010 | 5,377 | 5,201 | 5,819 | 5,654 | 6,090 | 5,693 | 5,568 | 6,075 | 5,712 | 5,907 | 5,533 | 5,686 |
| 2011 | 5,463 | 5,173 | 5,887 | 5,669 | 5,906 | 5,678 | 5,674 | 5,921 | 5,654 | 5,844 | 5,580 | 5,701 |
| 2012 | 5,438 | 5,419 | 5,878 | 5,658 | 5,941 | 5,807 | 5,629 | 6,048 | 5,644 | 6,003 | 5,599 | 5,692 |
| 2013 | 5,536 | 5,357 | 6,024 | 5,733 | 6,002 | 5,941 | 5,855 | 6,187 | 5,855 | 6,176 | 5,869 | 5,884 |
| 2014 | 5,691 | 5,545 | 6,108 | 6,063 | 6,286 | 6,058 | 6,183 | 6,386 | 6,043 | 6,465 | 6,048 | 6,233 |
| 2015 | 6,136 | 5,855 | 6,487 | 6,364 | 6,512 | 6,346 | 6,557 | 6,660 | 6,398 | 6,619 | 6,270 | 6,409 |
| 2016 | 6,242 | 6,266 | 6,623 | 6,373 | 6,755 | 6,529 | 6,676 | 6,664 | 6,530 | 6,781 | 6,388 | 6,358 |
| 2017 | 6,238 | 5,959 | 6,898 | 6,708 | 6,915 | 6,599 | 6,670 | 6,161 | 6,608 | 7,115 | 6,707 | 6,674 |
| 2018 | 6,076 | 5,991 | 6,822 | 6,545 | 6,874 | 6,541 | 6,525 | 6,894 | 6,365 | 6,758 | 6,420 | 6,499 |
| 2019 | 6,313 | 5,986 | 6,754 | 6,493 | 6,716 | 6,515 | 6,576 | 6,924 | 6,551 | 7,026 | 6,471 | 6,503 |
| 2020 | 6,279 | 6,250 | 5,876 | 4,027 | 5,568 | 5,664 | 5,528 | 5,989 | 5,642 | 6,299 | 5,560 | 5,707 |
| 2021 | 5,553 | 4,792 | 6,340 | 6,505 | 6,338 | 6,121 | 6,592 | 6,508 | 6,222 | 6,696 | 6,677 | 6,553 |
| 2022 | 5,909 | 5,779 | 6,459 | 6,659 | 7,077 | 6,670 | 6,876 | 6,823 | 6,951 | 7,008 | 6,525 | 6,878 |
| 2023 | 6,453 | 6,335 | 7,315 | 6,813 | 6,968 | 7,108 | 6,854 | 7,147 | 7,067 | 7,109 | 6,646 | 6,593 |
| 2024 | 6,388 | |||||||||||
| - = No Data Reported; -- = Not Applicable; NA = Not Available; W = Withheld to avoid disclosure of individual company data. |
| Release Date: 3/29/2024 |
| Next Release Date: 4/30/2024 |