|
Download Data (XLS File) |
|
||||||||
|
||||||||
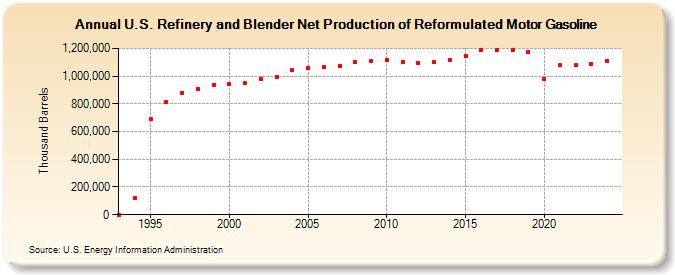
| U.S. Refinery and Blender Net Production of Reformulated Motor Gasoline (Thousand Barrels) | ||||||||
| Decade | Year-0 | Year-1 | Year-2 | Year-3 | Year-4 | Year-5 | Year-6 | Year-7 | Year-8 | Year-9 |
|---|---|---|---|---|---|---|---|---|---|---|
| 1990's | 0 | 124,074 | 687,503 | 812,750 | 878,200 | 906,419 | 936,002 | |||
| 2000's | 939,493 | 947,745 | 981,978 | 990,851 | 1,040,822 | 1,057,896 | 1,068,929 | 1,073,665 | 1,099,958 | 1,106,532 |
| 2010's | 1,114,738 | 1,103,794 | 1,096,709 | 1,105,394 | 1,119,066 | 1,148,231 | 1,186,714 | 1,187,104 | 1,186,677 | 1,176,452 |
| 2020's | 977,791 | 1,077,721 | 1,077,117 | 1,090,794 |
| - = No Data Reported; -- = Not Applicable; NA = Not Available; W = Withheld to avoid disclosure of individual company data. |
| Release Date: 3/29/2024 |
| Next Release Date: 8/30/2024 |