|
Download Data (XLS File) |
|
||||||||
|
||||||||
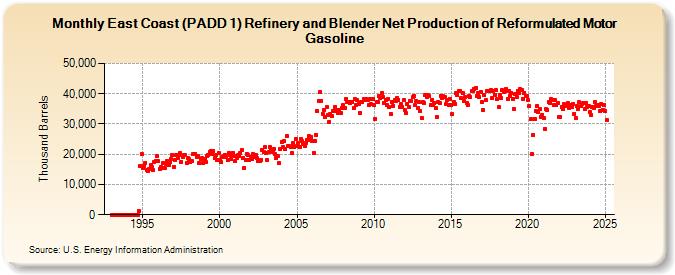
| East Coast (PADD 1) Refinery and Blender Net Production of Reformulated Motor Gasoline (Thousand Barrels) | ||||||||
| Year | Jan | Feb | Mar | Apr | May | Jun | Jul | Aug | Sep | Oct | Nov | Dec |
|---|---|---|---|---|---|---|---|---|---|---|---|---|
| 1993 | 0 | 0 | 0 | 0 | 0 | 0 | 0 | 0 | 0 | 0 | 0 | 0 |
| 1994 | 0 | 0 | 0 | 0 | 0 | 0 | 0 | 0 | 70 | 1,186 | 16,065 | 20,090 |
| 1995 | 15,466 | 16,073 | 17,149 | 14,901 | 14,408 | 15,190 | 16,333 | 15,902 | 14,850 | 17,570 | 17,833 | 19,348 |
| 1996 | 17,647 | 15,133 | 15,668 | 15,534 | 17,117 | 15,576 | 16,908 | 17,836 | 16,429 | 17,336 | 18,350 | 19,661 |
| 1997 | 15,908 | 17,935 | 19,684 | 18,673 | 19,720 | 20,269 | 17,510 | 19,105 | 19,630 | 19,637 | 17,166 | 18,775 |
| 1998 | 18,291 | 17,413 | 17,787 | 19,967 | 20,200 | 20,129 | 19,039 | 19,488 | 17,134 | 18,444 | 18,694 | 17,237 |
| 1999 | 18,490 | 17,382 | 19,442 | 19,833 | 20,816 | 21,048 | 20,041 | 20,983 | 18,606 | 19,657 | 18,114 | 20,347 |
| 2000 | 18,031 | 17,273 | 19,055 | 19,429 | 19,835 | 19,050 | 18,145 | 20,506 | 19,807 | 18,473 | 20,326 | 19,511 |
| 2001 | 17,903 | 18,808 | 19,586 | 19,411 | 20,401 | 21,313 | 18,839 | 15,474 | 17,974 | 20,229 | 19,903 | 18,189 |
| 2002 | 19,105 | 18,522 | 20,062 | 19,198 | 19,841 | 18,636 | 17,776 | 17,620 | 18,221 | 21,341 | 20,629 | 22,285 |
| 2003 | 20,407 | 18,010 | 20,571 | 22,281 | 21,541 | 20,863 | 21,873 | 19,989 | 18,884 | 19,430 | 16,985 | 21,842 |
| 2004 | 24,063 | 22,363 | 24,367 | 21,594 | 26,043 | 22,760 | 22,701 | 22,262 | 20,364 | 23,798 | 22,258 | 25,157 |
| 2005 | 22,867 | 23,687 | 22,276 | 24,877 | 24,207 | 23,460 | 22,645 | 23,796 | 24,675 | 25,892 | 24,698 | 25,810 |
| 2006 | 24,477 | 20,421 | 24,500 | 26,455 | 34,233 | 37,669 | 40,540 | 37,637 | 33,409 | 34,581 | 32,407 | 35,523 |
| 2007 | 32,852 | 30,786 | 33,196 | 32,520 | 34,306 | 34,195 | 35,616 | 34,597 | 33,494 | 34,682 | 33,481 | 35,336 |
| 2008 | 36,160 | 35,390 | 38,154 | 37,138 | 37,425 | 36,854 | 37,343 | 37,119 | 35,197 | 38,257 | 36,225 | 37,964 |
| 2009 | 36,608 | 33,649 | 37,168 | 37,235 | 38,127 | 37,925 | 38,212 | 38,091 | 36,244 | 38,174 | 36,485 | 38,222 |
| 2010 | 36,237 | 31,761 | 37,309 | 37,158 | 39,361 | 38,508 | 40,127 | 38,905 | 36,863 | 37,873 | 36,349 | 38,304 |
| 2011 | 35,451 | 33,236 | 37,356 | 36,062 | 37,835 | 37,617 | 38,464 | 38,078 | 35,754 | 36,497 | 35,641 | 37,999 |
| 2012 | 34,528 | 33,509 | 36,541 | 35,628 | 37,731 | 37,441 | 38,810 | 39,273 | 36,166 | 37,725 | 35,322 | 37,132 |
| 2013 | 34,184 | 31,959 | 37,174 | 36,957 | 39,551 | 38,981 | 39,483 | 39,094 | 36,268 | 38,024 | 36,403 | 37,000 |
| 2014 | 35,213 | 32,331 | 37,131 | 37,068 | 39,355 | 38,449 | 39,114 | 38,890 | 36,571 | 37,987 | 36,412 | 38,192 |
| 2015 | 36,274 | 33,244 | 37,273 | 36,699 | 40,276 | 39,660 | 40,826 | 40,836 | 38,452 | 40,104 | 37,623 | 38,921 |
| 2016 | 36,928 | 36,258 | 39,370 | 38,835 | 40,807 | 40,952 | 41,574 | 41,851 | 39,270 | 40,389 | 38,867 | 40,496 |
| 2017 | 37,296 | 34,634 | 39,463 | 37,844 | 40,828 | 40,963 | 40,831 | 41,220 | 38,488 | 40,966 | 39,693 | 41,097 |
| 2018 | 38,094 | 35,633 | 39,534 | 38,738 | 41,166 | 40,503 | 41,057 | 41,562 | 38,403 | 41,024 | 39,085 | 40,260 |
| 2019 | 38,422 | 34,992 | 39,904 | 38,798 | 41,043 | 40,216 | 41,410 | 41,113 | 38,385 | 40,397 | 39,188 | 39,363 |
| 2020 | 37,857 | 36,014 | 31,515 | 20,110 | 26,352 | 31,637 | 34,412 | 35,860 | 33,993 | 34,863 | 32,471 | 33,110 |
| 2021 | 31,874 | 28,425 | 34,825 | 34,774 | 37,173 | 37,028 | 38,261 | 38,028 | 36,290 | 37,826 | 36,321 | 36,774 |
| 2022 | 32,186 | 32,416 | 35,651 | 34,899 | 36,494 | 35,982 | 36,118 | 36,820 | 35,237 | 36,426 | 35,722 | 36,569 |
| 2023 | 33,429 | 32,070 | 36,122 | 35,279 | 37,329 | 35,840 | 36,542 | 37,018 | 34,980 | 36,923 | 35,610 | 35,782 |
| 2024 | 34,119 | 33,057 | 35,703 | 35,297 | ||||||||
| - = No Data Reported; -- = Not Applicable; NA = Not Available; W = Withheld to avoid disclosure of individual company data. |
| Release Date: 6/28/2024 |
| Next Release Date: 7/31/2024 |