|
Download Data (XLS File) |
|
||||||||
|
||||||||
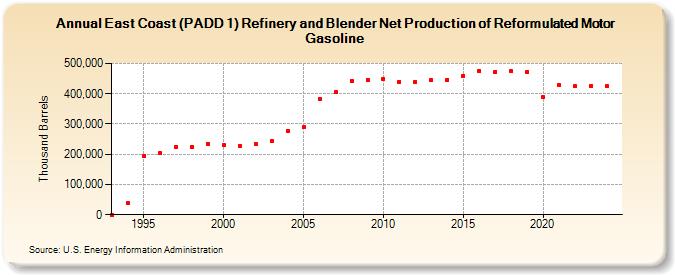
| East Coast (PADD 1) Refinery and Blender Net Production of Reformulated Motor Gasoline (Thousand Barrels) | ||||||||
| Decade | Year-0 | Year-1 | Year-2 | Year-3 | Year-4 | Year-5 | Year-6 | Year-7 | Year-8 | Year-9 |
|---|---|---|---|---|---|---|---|---|---|---|
| 1990's | 0 | 37,411 | 195,023 | 203,195 | 224,012 | 223,823 | 234,759 | |||
| 2000's | 229,441 | 228,030 | 233,236 | 242,676 | 277,730 | 288,890 | 381,852 | 405,061 | 443,226 | 446,140 |
| 2010's | 448,755 | 439,990 | 439,806 | 445,078 | 446,713 | 460,188 | 475,597 | 473,323 | 475,059 | 473,231 |
| 2020's | 388,194 | 427,599 | 424,520 | 426,924 |
| - = No Data Reported; -- = Not Applicable; NA = Not Available; W = Withheld to avoid disclosure of individual company data. |
| Release Date: 6/28/2024 |
| Next Release Date: 8/30/2024 |