|
Download Data (XLS File) |
|
||||||||
|
||||||||
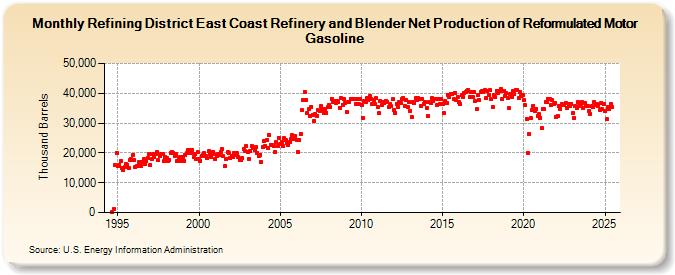
| Refining District East Coast Refinery and Blender Net Production of Reformulated Motor Gasoline (Thousand Barrels) | ||||||||
| Year | Jan | Feb | Mar | Apr | May | Jun | Jul | Aug | Sep | Oct | Nov | Dec |
|---|---|---|---|---|---|---|---|---|---|---|---|---|
| 1994 | 70 | 1,186 | 15,911 | 19,902 | ||||||||
| 1995 | 15,520 | 16,073 | 17,149 | 14,901 | 14,408 | 15,190 | 16,333 | 15,902 | 14,850 | 17,570 | 17,833 | 19,348 |
| 1996 | 17,647 | 15,133 | 15,668 | 15,534 | 17,117 | 15,576 | 16,908 | 17,836 | 16,429 | 17,336 | 18,350 | 19,661 |
| 1997 | 15,908 | 17,935 | 19,684 | 18,673 | 19,720 | 20,269 | 17,510 | 19,105 | 19,630 | 19,637 | 17,166 | 18,775 |
| 1998 | 18,291 | 17,413 | 17,787 | 19,967 | 20,200 | 20,129 | 19,039 | 19,488 | 17,134 | 18,444 | 18,694 | 17,237 |
| 1999 | 18,490 | 17,382 | 19,442 | 19,833 | 20,816 | 21,048 | 20,041 | 20,983 | 18,606 | 19,657 | 18,114 | 20,347 |
| 2000 | 18,031 | 17,273 | 19,055 | 19,429 | 19,835 | 19,050 | 18,145 | 20,506 | 19,807 | 18,473 | 20,326 | 19,511 |
| 2001 | 17,903 | 18,808 | 19,586 | 19,411 | 20,401 | 21,313 | 18,839 | 15,474 | 17,974 | 20,229 | 19,903 | 18,189 |
| 2002 | 19,105 | 18,522 | 20,062 | 19,198 | 19,841 | 18,636 | 17,776 | 17,620 | 18,221 | 21,341 | 20,629 | 22,285 |
| 2003 | 20,407 | 18,010 | 20,571 | 22,281 | 21,541 | 20,863 | 21,873 | 19,989 | 18,884 | 19,430 | 16,985 | 21,842 |
| 2004 | 24,063 | 22,363 | 24,367 | 21,594 | 26,043 | 22,760 | 22,701 | 22,262 | 20,364 | 23,798 | 22,258 | 25,157 |
| 2005 | 22,867 | 23,687 | 22,276 | 24,877 | 24,207 | 23,460 | 22,645 | 23,796 | 24,675 | 25,892 | 24,698 | 25,810 |
| 2006 | 24,477 | 20,421 | 24,500 | 26,455 | 34,233 | 37,669 | 40,540 | 37,637 | 33,409 | 34,581 | 32,407 | 35,523 |
| 2007 | 32,852 | 30,786 | 33,196 | 32,520 | 34,306 | 34,195 | 35,616 | 34,597 | 33,494 | 34,682 | 33,481 | 35,336 |
| 2008 | 36,160 | 35,390 | 38,154 | 37,138 | 37,425 | 36,854 | 37,343 | 37,119 | 35,197 | 38,257 | 36,225 | 37,964 |
| 2009 | 36,608 | 33,649 | 37,168 | 37,235 | 38,127 | 37,925 | 38,212 | 38,091 | 36,244 | 38,174 | 36,485 | 38,222 |
| 2010 | 36,237 | 31,761 | 37,309 | 37,151 | 38,495 | 37,659 | 39,244 | 38,006 | 36,321 | 37,873 | 36,349 | 38,304 |
| 2011 | 35,451 | 33,236 | 37,356 | 36,052 | 36,957 | 36,743 | 37,577 | 37,151 | 35,243 | 36,496 | 35,641 | 37,999 |
| 2012 | 34,528 | 33,509 | 36,541 | 35,504 | 37,056 | 36,814 | 38,154 | 38,488 | 35,804 | 37,725 | 35,322 | 37,132 |
| 2013 | 34,184 | 31,959 | 37,174 | 36,755 | 38,276 | 37,834 | 38,412 | 38,021 | 35,773 | 38,024 | 36,403 | 37,000 |
| 2014 | 35,213 | 32,331 | 37,131 | 36,903 | 38,491 | 37,541 | 38,243 | 38,007 | 36,104 | 37,987 | 36,412 | 38,192 |
| 2015 | 36,274 | 33,244 | 37,273 | 36,685 | 39,369 | 38,791 | 39,844 | 39,874 | 37,985 | 40,104 | 37,623 | 38,921 |
| 2016 | 36,928 | 36,258 | 39,370 | 38,722 | 40,129 | 40,287 | 40,926 | 41,160 | 38,743 | 40,389 | 38,867 | 40,496 |
| 2017 | 37,296 | 34,634 | 39,463 | 37,822 | 40,500 | 40,663 | 40,535 | 40,957 | 38,335 | 40,862 | 39,581 | 40,978 |
| 2018 | 37,974 | 35,550 | 39,428 | 38,633 | 40,916 | 40,261 | 40,709 | 41,322 | 38,252 | 40,934 | 38,988 | 40,152 |
| 2019 | 38,308 | 34,902 | 39,824 | 38,710 | 40,632 | 39,825 | 41,157 | 41,002 | 38,315 | 40,318 | 39,122 | 39,281 |
| 2020 | 37,793 | 35,966 | 31,451 | 20,082 | 26,340 | 31,621 | 34,371 | 35,858 | 33,991 | 34,860 | 32,470 | 33,104 |
| 2021 | 31,862 | 28,404 | 34,797 | 34,746 | 37,134 | 36,982 | 38,213 | 37,980 | 36,234 | 37,792 | 36,275 | 36,748 |
| 2022 | 32,159 | 32,386 | 35,609 | 34,848 | 36,455 | 35,914 | 36,068 | 36,771 | 35,190 | 36,359 | 35,682 | 36,515 |
| 2023 | 33,385 | 32,021 | 36,080 | 35,225 | 37,260 | 35,773 | 36,492 | 36,980 | 34,947 | 36,896 | 35,586 | 35,755 |
| 2024 | 34,098 | |||||||||||
| - = No Data Reported; -- = Not Applicable; NA = Not Available; W = Withheld to avoid disclosure of individual company data. |
| Release Date: 3/29/2024 |
| Next Release Date: 4/30/2024 |