|
Download Data (XLS File) |
|
||||||||
|
||||||||
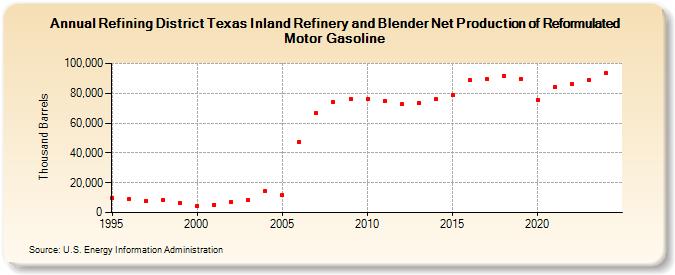
| Refining District Texas Inland Refinery and Blender Net Production of Reformulated Motor Gasoline (Thousand Barrels) | ||||||||
| Decade | Year-0 | Year-1 | Year-2 | Year-3 | Year-4 | Year-5 | Year-6 | Year-7 | Year-8 | Year-9 |
|---|---|---|---|---|---|---|---|---|---|---|
| 1990's | 9,602 | 9,130 | 8,019 | 8,609 | 6,704 | |||||
| 2000's | 4,415 | 5,353 | 7,157 | 8,391 | 14,432 | 11,854 | 47,647 | 66,929 | 73,876 | 76,231 |
| 2010's | 76,110 | 74,746 | 72,762 | 73,474 | 75,931 | 78,980 | 88,754 | 89,596 | 91,770 | 89,885 |
| 2020's | 75,639 | 84,131 | 86,458 | 89,015 |
| - = No Data Reported; -- = Not Applicable; NA = Not Available; W = Withheld to avoid disclosure of individual company data. |
| Release Date: 3/29/2024 |
| Next Release Date: 8/30/2024 |