|
Download Data (XLS File) |
|
||||||||
|
||||||||
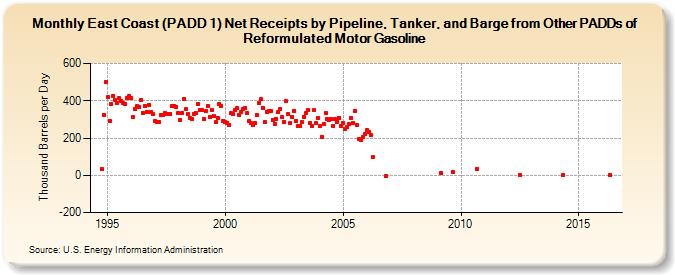
| East Coast (PADD 1) Net Receipts by Pipeline, Tanker, and Barge from Other PADDs of Reformulated Motor Gasoline (Thousand Barrels per Day) | ||||||||
| Year | Jan | Feb | Mar | Apr | May | Jun | Jul | Aug | Sep | Oct | Nov | Dec |
|---|---|---|---|---|---|---|---|---|---|---|---|---|
| 1994 | 33 | 326 | 501 | |||||||||
| 1995 | 420 | 291 | 384 | 428 | 405 | 387 | 415 | 400 | 388 | 381 | 417 | 425 |
| 1996 | 416 | 312 | 357 | 370 | 366 | 405 | 336 | 374 | 341 | 376 | 342 | 329 |
| 1997 | 294 | 288 | 286 | 326 | 323 | 334 | 331 | 330 | 329 | 374 | 372 | 366 |
| 1998 | 333 | 299 | 333 | 410 | 354 | 327 | 310 | 304 | 328 | 336 | 385 | 353 |
| 1999 | 350 | 303 | 343 | 373 | 315 | 348 | 317 | 285 | 309 | 383 | 373 | 293 |
| 2000 | 288 | 283 | 271 | 332 | 329 | 353 | 359 | 325 | 340 | 356 | 361 | 332 |
| 2001 | 290 | 280 | 272 | 278 | 323 | 389 | 407 | 363 | 287 | 340 | 343 | 347 |
| 2002 | 299 | 277 | 302 | 340 | 358 | 311 | 286 | 396 | 331 | 278 | 314 | 345 |
| 2003 | 293 | 263 | 265 | 285 | 315 | 333 | 351 | 280 | 262 | 349 | 279 | 308 |
| 2004 | 267 | 207 | 277 | 334 | 304 | 298 | 301 | 266 | 301 | 288 | 310 | 267 |
| 2005 | 278 | 249 | 258 | 274 | 310 | 283 | 346 | 268 | 197 | 191 | 206 | 220 |
| 2006 | 242 | 231 | 215 | 96 | -5 | |||||||
| 2009 | 10 | 19 | ||||||||||
| 2010 | 35 | |||||||||||
| 2012 | 3 | |||||||||||
| 2014 | 2 | |||||||||||
| 2016 | 1 | |||||||||||
| - = No Data Reported; -- = Not Applicable; NA = Not Available; W = Withheld to avoid disclosure of individual company data. |
| Release Date: 3/29/2024 |
| Next Release Date: 4/30/2024 |