|
Download Data (XLS File) |
|
||||||||
|
||||||||
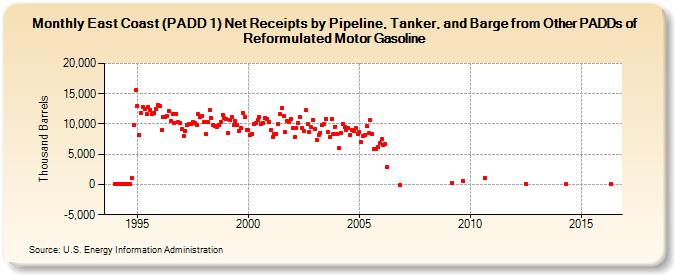
| East Coast (PADD 1) Net Receipts by Pipeline, Tanker, and Barge from Other PADDs of Reformulated Motor Gasoline (Thousand Barrels) | ||||||||
| Year | Jan | Feb | Mar | Apr | May | Jun | Jul | Aug | Sep | Oct | Nov | Dec |
|---|---|---|---|---|---|---|---|---|---|---|---|---|
| 1994 | 0 | 0 | 0 | 0 | 0 | 0 | 0 | 0 | 0 | 1,027 | 9,770 | 15,545 |
| 1995 | 13,021 | 8,156 | 11,894 | 12,838 | 12,557 | 11,612 | 12,852 | 12,385 | 11,632 | 11,821 | 12,510 | 13,173 |
| 1996 | 12,891 | 9,048 | 11,078 | 11,109 | 11,343 | 12,153 | 10,416 | 11,586 | 10,223 | 11,655 | 10,271 | 10,205 |
| 1997 | 9,123 | 8,059 | 8,869 | 9,779 | 9,998 | 10,014 | 10,270 | 10,242 | 9,865 | 11,603 | 11,174 | 11,361 |
| 1998 | 10,338 | 8,371 | 10,335 | 12,287 | 10,968 | 9,814 | 9,624 | 9,435 | 9,847 | 10,402 | 11,553 | 10,945 |
| 1999 | 10,836 | 8,483 | 10,633 | 11,193 | 9,771 | 10,438 | 9,826 | 8,850 | 9,275 | 11,880 | 11,188 | 9,077 |
| 2000 | 8,943 | 8,203 | 8,398 | 9,961 | 10,195 | 10,603 | 11,115 | 10,074 | 10,194 | 11,033 | 10,820 | 10,298 |
| 2001 | 8,983 | 7,848 | 8,421 | 8,352 | 10,028 | 11,658 | 12,628 | 11,263 | 8,619 | 10,550 | 10,291 | 10,769 |
| 2002 | 9,270 | 7,767 | 9,357 | 10,197 | 11,085 | 9,323 | 8,855 | 12,275 | 9,938 | 8,613 | 9,431 | 10,686 |
| 2003 | 9,095 | 7,375 | 8,216 | 8,537 | 9,756 | 10,001 | 10,874 | 8,674 | 7,859 | 10,816 | 8,355 | 9,562 |
| 2004 | 8,263 | 6,011 | 8,577 | 10,015 | 9,436 | 8,936 | 9,322 | 8,260 | 9,040 | 8,917 | 9,312 | 8,265 |
| 2005 | 8,632 | 6,966 | 8,001 | 8,214 | 9,596 | 8,495 | 10,716 | 8,322 | 5,896 | 5,924 | 6,167 | 6,835 |
| 2006 | 7,500 | 6,478 | 6,653 | 2,892 | -140 | |||||||
| 2009 | 315 | 580 | ||||||||||
| 2010 | 1,064 | |||||||||||
| 2012 | 80 | |||||||||||
| 2014 | 50 | |||||||||||
| 2016 | 44 | |||||||||||
| - = No Data Reported; -- = Not Applicable; NA = Not Available; W = Withheld to avoid disclosure of individual company data. |
| Release Date: 6/28/2024 |
| Next Release Date: 7/31/2024 |