|
Download Data (XLS File) |
|
||||||||
|
||||||||
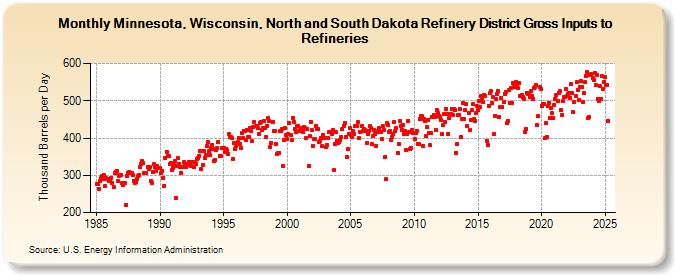
| Minnesota, Wisconsin, North and South Dakota Refinery District Gross Inputs to Refineries (Thousand Barrels per Day) | ||||||||
| Year | Jan | Feb | Mar | Apr | May | Jun | Jul | Aug | Sep | Oct | Nov | Dec |
|---|---|---|---|---|---|---|---|---|---|---|---|---|
| 1985 | 277 | 276 | 264 | 284 | 293 | 298 | 290 | 300 | 270 | 292 | 291 | 291 |
| 1986 | 285 | 284 | 293 | 280 | 269 | 306 | 309 | 312 | 284 | 299 | 302 | 302 |
| 1987 | 278 | 274 | 278 | 278 | 221 | 299 | 306 | 310 | 307 | 306 | 301 | 286 |
| 1988 | 280 | 281 | 291 | 298 | 300 | 321 | 331 | 339 | 332 | 307 | 306 | 305 |
| 1989 | 321 | 316 | 321 | 284 | 279 | 310 | 329 | 321 | 312 | 326 | 319 | 319 |
| 1990 | 319 | 306 | 311 | 294 | 272 | 347 | 363 | 351 | 352 | 329 | 333 | 314 |
| 1991 | 319 | 328 | 338 | 240 | 324 | 346 | 330 | 323 | 307 | 321 | 335 | 328 |
| 1992 | 323 | 329 | 327 | 336 | 333 | 325 | 337 | 335 | 323 | 337 | 331 | 344 |
| 1993 | 347 | 353 | 365 | 317 | 328 | 366 | 347 | 355 | 379 | 388 | 364 | 354 |
| 1994 | 373 | 382 | 370 | 339 | 341 | 369 | 372 | 389 | 352 | 351 | 374 | 374 |
| 1995 | 374 | 363 | 370 | 368 | 358 | 410 | 404 | 403 | 399 | 343 | 387 | 371 |
| 1996 | 378 | 388 | 401 | 385 | 374 | 413 | 400 | 420 | 419 | 396 | 422 | 402 |
| 1997 | 404 | 426 | 418 | 391 | 430 | 443 | 431 | 432 | 426 | 411 | 440 | 443 |
| 1998 | 422 | 427 | 445 | 426 | 404 | 432 | 453 | 447 | 376 | 386 | 444 | 419 |
| 1999 | 419 | 385 | 358 | 361 | 360 | 418 | 418 | 423 | 326 | 395 | 426 | 408 |
| 2000 | 398 | 411 | 441 | 407 | 394 | 455 | 444 | 425 | 417 | 432 | 431 | 420 |
| 2001 | 422 | 423 | 428 | 417 | 429 | 428 | 399 | 425 | 326 | 405 | 443 | 422 |
| 2002 | 378 | 397 | 397 | 432 | 423 | 424 | 389 | 393 | 400 | 379 | 408 | 401 |
| 2003 | 375 | 382 | 401 | 415 | 415 | 417 | 410 | 421 | 313 | 385 | 415 | 393 |
| 2004 | 387 | 389 | 394 | 404 | 425 | 433 | 439 | 404 | 349 | 370 | 412 | 428 |
| 2005 | 409 | 403 | 420 | 411 | 432 | 432 | 432 | 442 | 399 | 416 | 431 | 420 |
| 2006 | 423 | 421 | 418 | 387 | 411 | 420 | 432 | 427 | 383 | 405 | 422 | 411 |
| 2007 | 379 | 415 | 418 | 427 | 417 | 398 | 432 | 421 | 349 | 289 | 439 | 436 |
| 2008 | 416 | 419 | 395 | 404 | 411 | 443 | 419 | 427 | 360 | 385 | 445 | 433 |
| 2009 | 421 | 435 | 412 | 420 | 369 | 411 | 447 | 416 | 371 | 374 | 422 | 414 |
| 2010 | 398 | 414 | 419 | 385 | 385 | 451 | 460 | 458 | 378 | 452 | 447 | 406 |
| 2011 | 429 | 449 | 414 | 380 | 414 | 457 | 463 | 457 | 421 | 476 | 468 | 458 |
| 2012 | 456 | 448 | 412 | 434 | 464 | 442 | 478 | 465 | 410 | 453 | 465 | 478 |
| 2013 | 462 | 479 | 475 | 361 | 384 | 462 | 462 | 477 | 403 | 452 | 493 | 452 |
| 2014 | 475 | 491 | 431 | 467 | 422 | 449 | 474 | 491 | 450 | 447 | 467 | 486 |
| 2015 | 475 | 498 | 482 | 513 | 503 | 497 | 516 | 514 | 393 | 382 | 487 | 520 |
| 2016 | 526 | 493 | 509 | 410 | 460 | 505 | 517 | 525 | 457 | 483 | 508 | 483 |
| 2017 | 497 | 519 | 524 | 439 | 447 | 528 | 494 | 533 | 495 | 548 | 538 | 537 |
| 2018 | 551 | 544 | 533 | 547 | 514 | 516 | 509 | 506 | 417 | 425 | 522 | 518 |
| 2019 | 517 | 510 | 525 | 512 | 505 | 535 | 536 | 542 | 434 | 459 | 536 | 531 |
| 2020 | 486 | 492 | 491 | 400 | 440 | 404 | 485 | 495 | 454 | 481 | 466 | 454 |
| 2021 | 489 | 505 | 515 | 498 | 522 | 525 | 476 | 462 | 498 | 510 | 509 | 532 |
| 2022 | 512 | 519 | 521 | 508 | 546 | 520 | 469 | 497 | 512 | 549 | 530 | 501 |
| 2023 | 537 | 552 | 537 | 496 | 520 | 549 | 566 | 576 | 454 | 457 | 569 | 572 |
| 2024 | 561 | |||||||||||
| - = No Data Reported; -- = Not Applicable; NA = Not Available; W = Withheld to avoid disclosure of individual company data. |
| Release Date: 3/29/2024 |
| Next Release Date: 4/30/2024 |