|
Download Data (XLS File) |
|
||||||||
|
||||||||
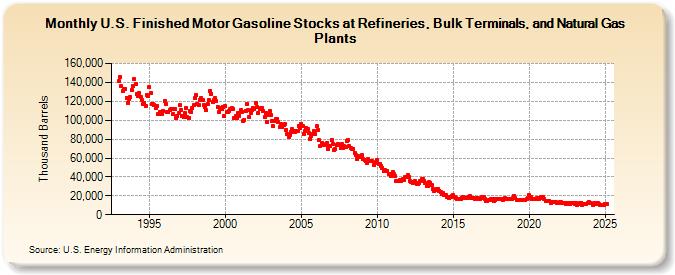
| U.S. Finished Motor Gasoline Stocks at Refineries, Bulk Terminals, and Natural Gas Plants (Thousand Barrels) | ||||||||
| Year | Jan | Feb | Mar | Apr | May | Jun | Jul | Aug | Sep | Oct | Nov | Dec |
|---|---|---|---|---|---|---|---|---|---|---|---|---|
| 1993 | 140,965 | 145,557 | 135,815 | 130,662 | 132,777 | 132,950 | 123,764 | 118,299 | 121,900 | 124,548 | 131,909 | 136,145 |
| 1994 | 143,280 | 138,237 | 127,435 | 126,021 | 128,498 | 124,889 | 121,235 | 116,864 | 118,335 | 115,236 | 126,804 | 125,374 |
| 1995 | 134,701 | 128,466 | 117,303 | 116,740 | 116,151 | 112,574 | 114,694 | 106,503 | 108,668 | 106,975 | 106,466 | 109,788 |
| 1996 | 120,181 | 117,107 | 108,765 | 108,140 | 111,000 | 111,646 | 111,565 | 106,511 | 111,649 | 102,688 | 104,065 | 107,859 |
| 1997 | 115,801 | 111,082 | 104,350 | 103,693 | 107,326 | 113,223 | 102,904 | 102,687 | 109,255 | 109,179 | 113,077 | 115,976 |
| 1998 | 123,300 | 126,240 | 117,138 | 115,997 | 121,749 | 123,337 | 121,078 | 115,644 | 113,756 | 110,758 | 116,957 | 120,947 |
| 1999 | 131,171 | 128,080 | 119,102 | 121,552 | 123,131 | 120,353 | 114,065 | 108,814 | 112,620 | 111,854 | 114,335 | 104,804 |
| 2000 | 114,610 | 108,706 | 108,580 | 110,100 | 111,716 | 112,646 | 112,240 | 102,505 | 104,278 | 101,827 | 107,331 | 104,934 |
| 2001 | 110,480 | 109,011 | 98,964 | 100,718 | 109,849 | 117,039 | 110,553 | 102,909 | 107,950 | 111,145 | 112,577 | 112,119 |
| 2002 | 118,323 | 113,911 | 107,954 | 111,364 | 113,170 | 112,683 | 109,671 | 103,542 | 107,474 | 98,524 | 105,747 | 109,683 |
| 2003 | 105,709 | 99,546 | 93,742 | 99,587 | 100,769 | 101,239 | 98,270 | 92,694 | 95,561 | 93,204 | 94,528 | 95,550 |
| 2004 | 89,887 | 85,119 | 82,608 | 84,209 | 87,436 | 90,336 | 89,040 | 87,549 | 88,115 | 88,979 | 93,746 | 92,243 |
| 2005 | 95,986 | 93,972 | 85,876 | 88,471 | 91,504 | 90,328 | 86,296 | 79,630 | 83,677 | 85,223 | 88,417 | 85,662 |
| 2006 | 93,436 | 90,033 | 78,759 | 72,785 | 76,154 | 74,769 | 73,828 | 73,260 | 75,559 | 69,827 | 72,456 | 72,968 |
| 2007 | 79,538 | 74,868 | 68,718 | 69,253 | 73,844 | 74,763 | 74,236 | 70,303 | 74,498 | 70,839 | 72,375 | 71,470 |
| 2008 | 77,683 | 78,908 | 72,278 | 70,577 | 69,727 | 69,895 | 65,575 | 62,956 | 59,178 | 61,597 | 60,652 | 61,525 |
| 2009 | 62,992 | 58,631 | 57,496 | 57,199 | 55,034 | 58,900 | 56,655 | 56,444 | 56,759 | 52,374 | 55,170 | 55,254 |
| 2010 | 58,402 | 53,986 | 53,664 | 51,149 | 49,915 | 45,771 | 46,872 | 45,989 | 45,884 | 42,651 | 42,905 | 40,534 |
| 2011 | 45,292 | 42,707 | 40,431 | 35,271 | 35,918 | 36,147 | 36,369 | 36,034 | 37,452 | 37,002 | 39,480 | 39,717 |
| 2012 | 41,507 | 39,820 | 35,625 | 34,264 | 33,724 | 34,975 | 35,348 | 32,620 | 32,624 | 33,409 | 35,204 | 37,768 |
| 2013 | 37,300 | 36,080 | 33,292 | 30,723 | 30,481 | 34,087 | 34,004 | 31,496 | 27,320 | 25,490 | 26,044 | 27,121 |
| 2014 | 27,201 | 25,511 | 23,876 | 21,985 | 22,611 | 20,613 | 20,747 | 18,819 | 18,461 | 17,167 | 18,986 | 20,275 |
| 2015 | 20,608 | 18,853 | 17,477 | 16,848 | 16,653 | 16,982 | 16,666 | 17,999 | 19,193 | 18,047 | 17,345 | 18,133 |
| 2016 | 18,270 | 19,336 | 17,564 | 17,274 | 17,231 | 17,040 | 17,430 | 17,709 | 16,520 | 16,189 | 17,773 | 18,401 |
| 2017 | 18,639 | 16,790 | 14,545 | 14,862 | 15,638 | 15,758 | 16,135 | 16,917 | 14,174 | 15,884 | 17,037 | 16,798 |
| 2018 | 16,438 | 16,186 | 16,234 | 15,842 | 16,117 | 17,295 | 16,878 | 16,290 | 17,056 | 16,599 | 16,440 | 17,801 |
| 2019 | 20,114 | 17,195 | 15,527 | 15,109 | 15,546 | 15,526 | 15,505 | 15,950 | 15,431 | 16,055 | 16,839 | 17,839 |
| 2020 | 20,493 | 18,846 | 16,686 | 16,209 | 17,004 | 16,755 | 17,319 | 18,167 | 16,899 | 18,479 | 17,774 | 19,083 |
| 2021 | 16,414 | 14,662 | 14,605 | 14,928 | 14,748 | 12,459 | 13,263 | 13,013 | 13,586 | 12,927 | 12,065 | 12,324 |
| 2022 | 13,103 | 13,043 | 12,635 | 12,686 | 12,486 | 11,755 | 11,806 | 12,116 | 11,776 | 12,200 | 12,565 | 12,634 |
| 2023 | 11,863 | 12,803 | 10,744 | 11,201 | 12,283 | 12,829 | 10,793 | 10,861 | 11,217 | 11,344 | 12,424 | 13,718 |
| 2024 | 12,066 | |||||||||||
| - = No Data Reported; -- = Not Applicable; NA = Not Available; W = Withheld to avoid disclosure of individual company data. |
| Release Date: 3/29/2024 |
| Next Release Date: 4/30/2024 |