|
Download Data (XLS File) |
|
||||||||
|
||||||||
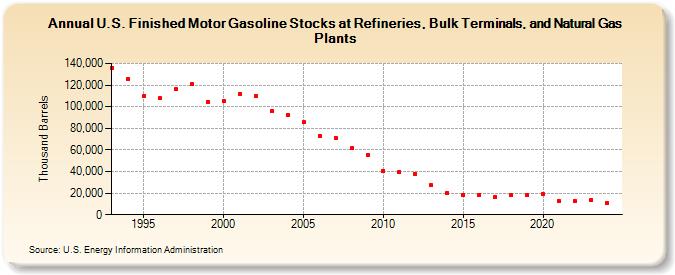
| U.S. Finished Motor Gasoline Stocks at Refineries, Bulk Terminals, and Natural Gas Plants (Thousand Barrels) | ||||||||
| Decade | Year-0 | Year-1 | Year-2 | Year-3 | Year-4 | Year-5 | Year-6 | Year-7 | Year-8 | Year-9 |
|---|---|---|---|---|---|---|---|---|---|---|
| 1990's | 136,145 | 125,374 | 109,788 | 107,859 | 115,976 | 120,947 | 104,804 | |||
| 2000's | 104,934 | 112,119 | 109,683 | 95,550 | 92,243 | 85,662 | 72,968 | 71,470 | 61,525 | 55,254 |
| 2010's | 40,534 | 39,717 | 37,768 | 27,121 | 20,275 | 18,133 | 18,401 | 16,798 | 17,801 | 17,839 |
| 2020's | 19,083 | 12,324 | 12,634 | 13,718 |
| - = No Data Reported; -- = Not Applicable; NA = Not Available; W = Withheld to avoid disclosure of individual company data. |
| Release Date: 6/28/2024 |
| Next Release Date: 8/30/2024 |