|
Download Data (XLS File) |
|
||||||||
|
||||||||
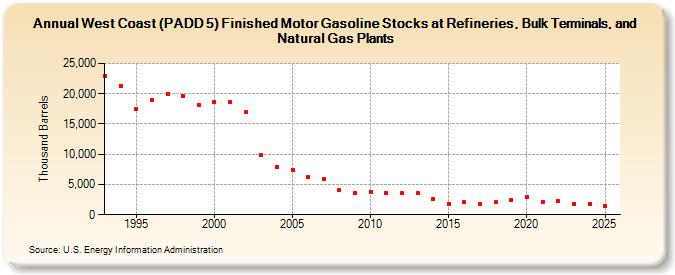
| West Coast (PADD 5) Finished Motor Gasoline Stocks at Refineries, Bulk Terminals, and Natural Gas Plants (Thousand Barrels) | ||||||||
| Decade | Year-0 | Year-1 | Year-2 | Year-3 | Year-4 | Year-5 | Year-6 | Year-7 | Year-8 | Year-9 |
|---|---|---|---|---|---|---|---|---|---|---|
| 1990's | 23,002 | 21,328 | 17,451 | 18,939 | 20,034 | 19,669 | 18,218 | |||
| 2000's | 18,656 | 18,713 | 17,009 | 9,927 | 7,917 | 7,474 | 6,160 | 5,935 | 4,087 | 3,663 |
| 2010's | 3,721 | 3,634 | 3,583 | 3,536 | 2,582 | 1,847 | 2,031 | 1,764 | 2,042 | 2,513 |
| 2020's | 2,877 | 2,074 | 2,186 | 1,747 |
| - = No Data Reported; -- = Not Applicable; NA = Not Available; W = Withheld to avoid disclosure of individual company data. |
| Release Date: 3/29/2024 |
| Next Release Date: 8/30/2024 |