|
Download Data (XLS File) |
|
||||||||
|
||||||||
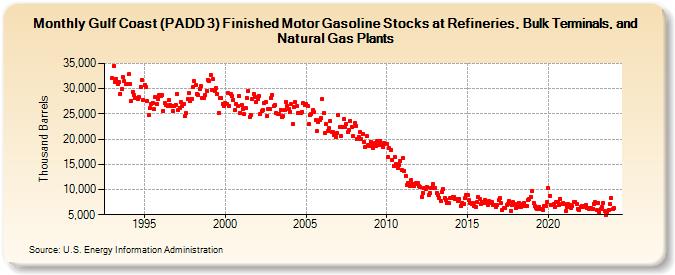
| Gulf Coast (PADD 3) Finished Motor Gasoline Stocks at Refineries, Bulk Terminals, and Natural Gas Plants (Thousand Barrels) | ||||||||
| Year | Jan | Feb | Mar | Apr | May | Jun | Jul | Aug | Sep | Oct | Nov | Dec |
|---|---|---|---|---|---|---|---|---|---|---|---|---|
| 1993 | 32,106 | 34,519 | 31,411 | 31,884 | 30,833 | 31,270 | 28,950 | 29,915 | 32,357 | 31,460 | 30,997 | 31,001 |
| 1994 | 32,815 | 30,874 | 27,592 | 29,432 | 28,688 | 28,106 | 28,159 | 27,959 | 28,289 | 30,369 | 31,753 | 27,843 |
| 1995 | 30,814 | 30,303 | 27,576 | 24,851 | 26,123 | 26,962 | 27,224 | 25,919 | 28,340 | 26,964 | 27,923 | 28,829 |
| 1996 | 28,621 | 28,667 | 25,592 | 27,149 | 26,753 | 26,630 | 27,701 | 26,852 | 26,481 | 25,494 | 26,491 | 26,828 |
| 1997 | 29,043 | 25,792 | 26,258 | 27,263 | 26,504 | 26,961 | 24,506 | 25,104 | 27,874 | 29,190 | 27,466 | 28,005 |
| 1998 | 30,319 | 31,466 | 30,679 | 28,989 | 28,787 | 29,942 | 30,477 | 28,102 | 28,239 | 28,781 | 29,609 | 31,783 |
| 1999 | 31,564 | 32,744 | 29,755 | 31,847 | 29,530 | 30,063 | 28,958 | 25,236 | 28,074 | 28,228 | 26,976 | 26,659 |
| 2000 | 27,242 | 26,902 | 29,054 | 26,649 | 28,966 | 28,570 | 27,758 | 25,774 | 26,877 | 26,647 | 28,559 | 25,151 |
| 2001 | 26,735 | 25,947 | 24,917 | 26,240 | 28,172 | 29,628 | 24,339 | 24,876 | 27,986 | 29,027 | 28,351 | 27,440 |
| 2002 | 28,034 | 28,631 | 25,060 | 25,505 | 25,858 | 27,109 | 27,326 | 24,605 | 25,924 | 26,024 | 28,123 | 28,784 |
| 2003 | 26,477 | 26,796 | 25,219 | 24,942 | 24,969 | 25,842 | 24,381 | 24,546 | 25,811 | 27,401 | 26,520 | 25,878 |
| 2004 | 25,375 | 26,905 | 22,982 | 26,418 | 27,349 | 26,544 | 25,136 | 25,264 | 25,081 | 25,458 | 27,085 | 26,786 |
| 2005 | 26,891 | 26,550 | 23,023 | 24,865 | 25,068 | 25,712 | 25,410 | 23,775 | 21,576 | 23,344 | 23,730 | 24,167 |
| 2006 | 27,989 | 25,166 | 21,193 | 22,907 | 21,620 | 22,141 | 23,678 | 21,358 | 21,392 | 20,737 | 20,393 | 21,164 |
| 2007 | 24,716 | 22,439 | 20,676 | 22,351 | 23,975 | 22,431 | 23,015 | 21,309 | 21,800 | 23,597 | 22,435 | 20,535 |
| 2008 | 23,198 | 22,679 | 20,063 | 20,498 | 21,370 | 19,967 | 21,026 | 19,435 | 18,488 | 20,576 | 18,736 | 18,578 |
| 2009 | 19,512 | 18,663 | 18,291 | 19,194 | 18,609 | 19,569 | 18,908 | 19,647 | 18,816 | 18,366 | 19,247 | 18,953 |
| 2010 | 18,995 | 16,472 | 18,182 | 17,935 | 15,783 | 14,718 | 16,431 | 15,080 | 14,251 | 14,929 | 15,615 | 13,904 |
| 2011 | 16,227 | 13,744 | 12,733 | 10,870 | 11,296 | 10,668 | 11,807 | 11,062 | 10,641 | 11,143 | 11,387 | 11,262 |
| 2012 | 10,599 | 10,503 | 8,612 | 9,286 | 10,300 | 10,031 | 10,472 | 8,865 | 9,277 | 10,286 | 11,065 | 10,201 |
| 2013 | 10,290 | 9,320 | 8,940 | 8,379 | 7,759 | 9,542 | 10,034 | 8,301 | 7,978 | 7,368 | 7,293 | 8,300 |
| 2014 | 8,276 | 8,601 | 8,514 | 8,099 | 8,150 | 7,644 | 8,123 | 6,812 | 7,407 | 7,118 | 8,241 | 8,873 |
| 2015 | 8,941 | 7,821 | 7,400 | 7,127 | 7,296 | 6,816 | 6,606 | 7,483 | 8,462 | 8,061 | 7,121 | 7,620 |
| 2016 | 7,254 | 7,998 | 7,441 | 6,889 | 7,651 | 7,234 | 7,481 | 7,026 | 6,828 | 6,536 | 6,946 | 7,894 |
| 2017 | 8,255 | 7,266 | 5,992 | 6,283 | 6,360 | 6,852 | 7,146 | 7,657 | 5,659 | 6,844 | 7,469 | 7,218 |
| 2018 | 6,343 | 6,550 | 7,387 | 6,721 | 6,594 | 7,071 | 7,228 | 6,772 | 6,733 | 7,850 | 8,137 | 8,538 |
| 2019 | 9,687 | 7,384 | 6,768 | 6,237 | 6,091 | 6,483 | 6,137 | 6,206 | 5,980 | 6,643 | 6,766 | 7,479 |
| 2020 | 10,296 | 8,794 | 6,996 | 6,989 | 7,134 | 6,548 | 7,566 | 7,590 | 6,915 | 8,204 | 7,137 | 7,295 |
| 2021 | 7,170 | 5,781 | 6,622 | 7,027 | 6,963 | 6,364 | 6,634 | 7,466 | 7,616 | 7,097 | 6,205 | 5,998 |
| 2022 | 6,622 | 6,661 | 6,568 | 6,695 | 6,997 | 6,372 | 6,178 | 6,350 | 6,320 | 6,206 | 7,204 | 7,427 |
| 2023 | 5,860 | 7,395 | 5,463 | 6,155 | 6,546 | 7,360 | 5,748 | 5,030 | 5,498 | 5,998 | 7,069 | 8,313 |
| 2024 | 6,069 | |||||||||||
| - = No Data Reported; -- = Not Applicable; NA = Not Available; W = Withheld to avoid disclosure of individual company data. |
| Release Date: 3/29/2024 |
| Next Release Date: 4/30/2024 |