|
Download Data (XLS File) |
|
||||||||
|
||||||||
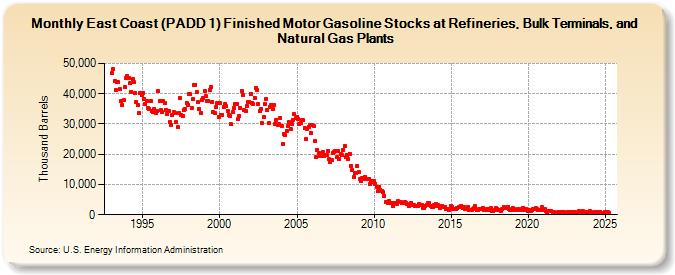
| East Coast (PADD 1) Finished Motor Gasoline Stocks at Refineries, Bulk Terminals, and Natural Gas Plants (Thousand Barrels) | ||||||||
| Year | Jan | Feb | Mar | Apr | May | Jun | Jul | Aug | Sep | Oct | Nov | Dec |
|---|---|---|---|---|---|---|---|---|---|---|---|---|
| 1993 | 46,852 | 48,041 | 44,236 | 41,226 | 43,890 | 43,805 | 41,472 | 37,515 | 36,333 | 37,892 | 42,168 | 45,292 |
| 1994 | 45,868 | 45,037 | 43,450 | 40,699 | 44,862 | 43,783 | 40,359 | 37,190 | 36,168 | 33,781 | 40,090 | 39,485 |
| 1995 | 40,269 | 38,306 | 36,618 | 37,621 | 35,170 | 34,967 | 37,617 | 34,172 | 33,942 | 34,956 | 33,549 | 34,187 |
| 1996 | 40,764 | 37,545 | 34,471 | 34,020 | 37,451 | 36,849 | 34,767 | 33,276 | 34,393 | 30,720 | 29,668 | 32,802 |
| 1997 | 34,079 | 33,534 | 30,598 | 29,043 | 33,673 | 38,509 | 33,121 | 32,677 | 34,698 | 35,041 | 36,972 | 36,411 |
| 1998 | 39,875 | 39,745 | 35,194 | 38,163 | 42,817 | 43,041 | 40,428 | 37,197 | 34,831 | 33,577 | 38,067 | 38,723 |
| 1999 | 40,890 | 39,233 | 37,693 | 37,731 | 41,226 | 42,151 | 37,367 | 33,822 | 33,537 | 35,607 | 36,932 | 32,395 |
| 2000 | 36,847 | 33,030 | 33,101 | 35,750 | 36,624 | 35,782 | 34,348 | 32,958 | 32,599 | 29,857 | 33,809 | 35,264 |
| 2001 | 36,726 | 36,520 | 31,513 | 32,668 | 35,227 | 40,960 | 39,700 | 34,644 | 34,385 | 36,059 | 37,133 | 37,295 |
| 2002 | 40,029 | 37,041 | 36,546 | 38,735 | 41,917 | 41,380 | 36,445 | 34,282 | 34,938 | 30,221 | 32,430 | 36,498 |
| 2003 | 38,209 | 34,522 | 30,289 | 35,704 | 36,390 | 34,972 | 36,142 | 30,079 | 31,436 | 29,780 | 29,864 | 32,126 |
| 2004 | 29,343 | 23,437 | 26,706 | 26,213 | 27,747 | 29,433 | 30,693 | 28,205 | 30,083 | 31,386 | 33,189 | 31,908 |
| 2005 | 32,414 | 31,754 | 29,853 | 30,246 | 31,342 | 31,225 | 28,718 | 24,968 | 28,468 | 29,063 | 29,814 | 26,912 |
| 2006 | 29,757 | 29,455 | 24,370 | 18,984 | 21,534 | 20,464 | 19,413 | 19,398 | 20,863 | 19,478 | 19,760 | 19,682 |
| 2007 | 21,148 | 18,314 | 17,556 | 18,167 | 20,379 | 20,575 | 21,093 | 19,084 | 21,056 | 18,553 | 20,120 | 19,732 |
| 2008 | 21,527 | 22,722 | 18,959 | 19,799 | 18,420 | 20,182 | 16,132 | 14,872 | 12,375 | 13,635 | 13,894 | 16,074 |
| 2009 | 14,091 | 11,722 | 11,113 | 11,992 | 11,824 | 12,617 | 11,937 | 11,675 | 11,826 | 10,195 | 11,016 | 10,858 |
| 2010 | 11,137 | 10,260 | 9,121 | 7,743 | 9,182 | 8,242 | 7,677 | 7,363 | 6,318 | 4,147 | 4,178 | 3,913 |
| 2011 | 4,542 | 3,900 | 3,826 | 3,040 | 3,737 | 3,899 | 3,675 | 4,436 | 4,319 | 4,106 | 3,868 | 3,741 |
| 2012 | 4,231 | 3,748 | 3,408 | 2,784 | 3,125 | 3,968 | 3,352 | 3,124 | 2,848 | 2,836 | 2,766 | 3,513 |
| 2013 | 3,306 | 3,108 | 2,148 | 2,282 | 2,947 | 3,296 | 3,722 | 3,755 | 2,837 | 2,600 | 2,688 | 3,190 |
| 2014 | 3,506 | 2,850 | 3,077 | 2,358 | 3,038 | 2,983 | 2,648 | 2,618 | 1,947 | 1,761 | 1,627 | 1,785 |
| 2015 | 2,974 | 2,568 | 1,902 | 1,998 | 2,036 | 2,081 | 2,576 | 2,568 | 2,995 | 2,384 | 2,433 | 1,901 |
| 2016 | 2,231 | 2,538 | 1,544 | 1,567 | 1,588 | 1,962 | 2,094 | 2,796 | 1,598 | 1,445 | 1,839 | 1,843 |
| 2017 | 1,868 | 2,213 | 1,509 | 1,574 | 1,774 | 1,798 | 1,599 | 2,241 | 1,377 | 1,389 | 1,692 | 2,069 |
| 2018 | 1,966 | 1,442 | 1,414 | 1,367 | 2,003 | 2,558 | 2,073 | 2,249 | 2,656 | 1,836 | 1,453 | 1,527 |
| 2019 | 2,187 | 1,862 | 1,544 | 1,427 | 2,018 | 1,651 | 1,716 | 2,011 | 2,242 | 1,679 | 1,961 | 1,556 |
| 2020 | 1,390 | 1,532 | 1,180 | 1,448 | 1,888 | 2,043 | 2,108 | 1,876 | 1,514 | 1,571 | 1,493 | 2,392 |
| 2021 | 1,637 | 1,778 | 1,093 | 1,062 | 1,290 | 1,074 | 1,096 | 861 | 882 | 656 | 697 | 758 |
| 2022 | 784 | 720 | 955 | 802 | 862 | 669 | 643 | 810 | 963 | 952 | 646 | 545 |
| 2023 | 986 | 732 | 483 | 729 | 1,154 | 798 | 729 | 1,081 | 971 | 629 | 731 | 736 |
| 2024 | 1,094 | |||||||||||
| - = No Data Reported; -- = Not Applicable; NA = Not Available; W = Withheld to avoid disclosure of individual company data. |
| Release Date: 3/29/2024 |
| Next Release Date: 4/30/2024 |