|
Download Data (XLS File) |
|
||||||||
|
||||||||
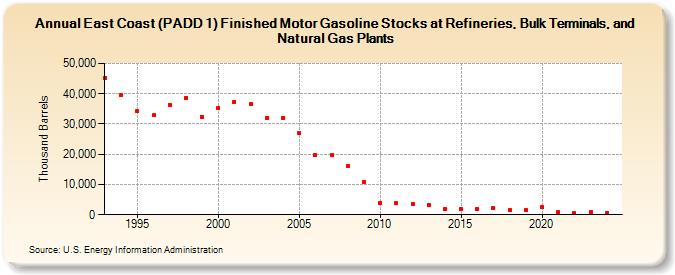
| East Coast (PADD 1) Finished Motor Gasoline Stocks at Refineries, Bulk Terminals, and Natural Gas Plants (Thousand Barrels) | ||||||||
| Decade | Year-0 | Year-1 | Year-2 | Year-3 | Year-4 | Year-5 | Year-6 | Year-7 | Year-8 | Year-9 |
|---|---|---|---|---|---|---|---|---|---|---|
| 1990's | 45,292 | 39,485 | 34,187 | 32,802 | 36,411 | 38,723 | 32,395 | |||
| 2000's | 35,264 | 37,295 | 36,498 | 32,126 | 31,908 | 26,912 | 19,682 | 19,732 | 16,074 | 10,858 |
| 2010's | 3,913 | 3,741 | 3,513 | 3,190 | 1,785 | 1,901 | 1,843 | 2,069 | 1,527 | 1,556 |
| 2020's | 2,392 | 758 | 545 | 736 |
| - = No Data Reported; -- = Not Applicable; NA = Not Available; W = Withheld to avoid disclosure of individual company data. |
| Release Date: 3/29/2024 |
| Next Release Date: 8/30/2024 |