|
Download Data (XLS File) |
|
||||||||
|
||||||||
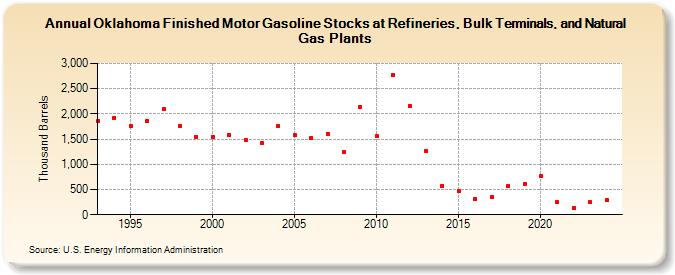
| Oklahoma Finished Motor Gasoline Stocks at Refineries, Bulk Terminals, and Natural Gas Plants (Thousand Barrels) | ||||||||
| Decade | Year-0 | Year-1 | Year-2 | Year-3 | Year-4 | Year-5 | Year-6 | Year-7 | Year-8 | Year-9 |
|---|---|---|---|---|---|---|---|---|---|---|
| 1990's | 1,864 | 1,926 | 1,755 | 1,852 | 2,092 | 1,759 | 1,547 | |||
| 2000's | 1,547 | 1,579 | 1,490 | 1,430 | 1,761 | 1,575 | 1,527 | 1,608 | 1,245 | 2,137 |
| 2010's | 1,559 | 2,777 | 2,163 | 1,254 | 577 | 464 | 319 | 348 | 562 | 601 |
| 2020's | 761 | 247 | 140 | 256 |
| - = No Data Reported; -- = Not Applicable; NA = Not Available; W = Withheld to avoid disclosure of individual company data. |
| Release Date: 3/29/2024 |
| Next Release Date: 8/30/2024 |