|
Download Data (XLS File) |
|
||||||||
|
||||||||
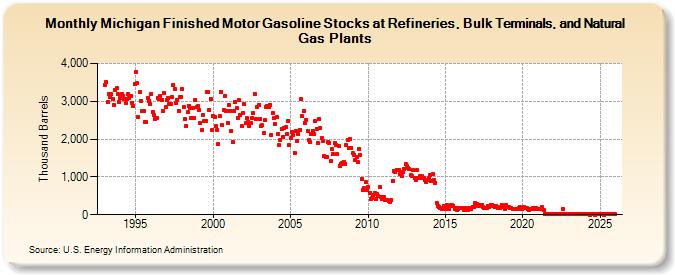
| Michigan Finished Motor Gasoline Stocks at Refineries, Bulk Terminals, and Natural Gas Plants (Thousand Barrels) | ||||||||
| Year | Jan | Feb | Mar | Apr | May | Jun | Jul | Aug | Sep | Oct | Nov | Dec |
|---|---|---|---|---|---|---|---|---|---|---|---|---|
| 1993 | 3,440 | 3,502 | 2,978 | 3,198 | 3,102 | 3,185 | 3,069 | 2,909 | 3,306 | 3,345 | 3,186 | 2,979 |
| 1994 | 3,093 | 3,206 | 3,146 | 3,063 | 2,947 | 3,061 | 3,193 | 3,080 | 3,127 | 2,962 | 2,882 | 3,450 |
| 1995 | 3,777 | 3,472 | 2,582 | 3,237 | 3,015 | 2,732 | 2,751 | 2,459 | 2,458 | 3,082 | 3,005 | 2,924 |
| 1996 | 3,202 | 2,726 | 2,648 | 2,534 | 2,567 | 3,098 | 3,061 | 3,134 | 3,044 | 2,748 | 3,222 | 2,840 |
| 1997 | 3,022 | 3,086 | 2,932 | 2,930 | 3,112 | 3,440 | 3,337 | 2,961 | 3,039 | 2,745 | 3,101 | 3,126 |
| 1998 | 3,325 | 2,862 | 2,527 | 2,339 | 2,709 | 2,878 | 2,829 | 2,570 | 2,812 | 2,554 | 3,036 | 2,861 |
| 1999 | 2,867 | 2,757 | 2,421 | 2,240 | 2,646 | 2,469 | 2,491 | 3,256 | 3,252 | 2,781 | 3,073 | 2,245 |
| 2000 | 2,610 | 2,597 | 2,346 | 2,243 | 1,869 | 2,599 | 3,246 | 2,365 | 2,767 | 3,134 | 2,754 | 2,437 |
| 2001 | 2,909 | 2,752 | 2,216 | 1,913 | 2,741 | 2,974 | 2,818 | 2,559 | 3,034 | 2,637 | 2,346 | 2,679 |
| 2002 | 2,930 | 2,420 | 2,553 | 2,456 | 2,353 | 2,431 | 2,564 | 2,688 | 3,200 | 2,519 | 2,852 | 2,889 |
| 2003 | 2,538 | 2,336 | 2,364 | 2,171 | 2,494 | 2,857 | 2,888 | 2,842 | 2,910 | 2,113 | 2,692 | 2,545 |
| 2004 | 2,412 | 2,579 | 2,147 | 1,833 | 1,969 | 2,273 | 2,060 | 2,282 | 2,308 | 2,123 | 2,491 | 1,848 |
| 2005 | 2,025 | 2,193 | 2,109 | 1,644 | 2,203 | 1,952 | 2,133 | 2,241 | 3,049 | 2,604 | 2,742 | 2,433 |
| 2006 | 2,514 | 2,206 | 1,977 | 1,915 | 2,126 | 2,226 | 2,138 | 2,472 | 2,273 | 1,901 | 2,532 | 2,281 |
| 2007 | 2,026 | 1,945 | 1,541 | 1,529 | 1,537 | 1,919 | 1,891 | 1,428 | 1,740 | 1,603 | 1,889 | 1,857 |
| 2008 | 1,598 | 1,820 | 1,289 | 1,342 | 1,371 | 1,395 | 1,351 | 1,852 | 1,987 | 1,757 | 1,997 | 1,772 |
| 2009 | 1,625 | 1,589 | 1,442 | 1,525 | 1,384 | 1,727 | 1,578 | 946 | 643 | 697 | 856 | 646 |
| 2010 | 733 | 571 | 403 | 444 | 528 | 565 | 415 | 556 | 494 | 727 | 478 | 423 |
| 2011 | 476 | 385 | 385 | 382 | 371 | 329 | 392 | 890 | 1,152 | 1,135 | 1,188 | 1,195 |
| 2012 | 1,191 | 1,082 | 1,011 | 1,118 | 1,210 | 1,332 | 1,284 | 1,243 | 1,202 | 1,042 | 1,011 | 1,174 |
| 2013 | 975 | 929 | 1,181 | 984 | 1,019 | 984 | 1,013 | 963 | 913 | 854 | 917 | 963 |
| 2014 | 1,040 | 887 | 1,071 | 921 | 850 | 317 | 241 | 209 | 174 | 161 | 180 | 239 |
| 2015 | 145 | 250 | 237 | 160 | 248 | 252 | 231 | 156 | 187 | 133 | 151 | 185 |
| 2016 | 182 | 183 | 136 | 186 | 137 | 125 | 172 | 173 | 157 | 206 | 195 | 319 |
| 2017 | 277 | 234 | 239 | 255 | 247 | 216 | 189 | 171 | 186 | 225 | 211 | 266 |
| 2018 | 255 | 237 | 198 | 233 | 197 | 176 | 188 | 199 | 245 | 205 | 163 | 252 |
| 2019 | 203 | 208 | 175 | 172 | 164 | 156 | 140 | 163 | 158 | 190 | 193 | 155 |
| 2020 | 176 | 194 | 185 | 179 | 147 | 123 | 139 | 154 | 175 | 150 | 173 | 153 |
| 2021 | 163 | 153 | 156 | 199 | 128 | 8 | 9 | 7 | 7 | 10 | 9 | 10 |
| 2022 | 10 | 12 | 7 | 7 | 9 | 13 | 10 | 148 | 13 | 9 | 13 | 12 |
| 2023 | 7 | 7 | 9 | 9 | 9 | 13 | 7 | 8 | 13 | 10 | 10 | 11 |
| 2024 | 11 | |||||||||||
| - = No Data Reported; -- = Not Applicable; NA = Not Available; W = Withheld to avoid disclosure of individual company data. |
| Release Date: 3/29/2024 |
| Next Release Date: 4/30/2024 |