|
Download Data (XLS File) |
|
||||||||
|
||||||||
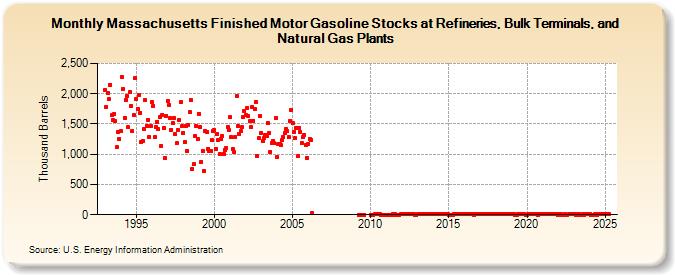
| Massachusetts Finished Motor Gasoline Stocks at Refineries, Bulk Terminals, and Natural Gas Plants (Thousand Barrels) | ||||||||
| Year | Jan | Feb | Mar | Apr | May | Jun | Jul | Aug | Sep | Oct | Nov | Dec |
|---|---|---|---|---|---|---|---|---|---|---|---|---|
| 1993 | 2,062 | 1,786 | 2,013 | 1,911 | 2,149 | 1,643 | 1,565 | 1,662 | 1,546 | 1,114 | 1,366 | 1,248 |
| 1994 | 1,380 | 2,280 | 2,081 | 1,604 | 1,900 | 1,961 | 1,443 | 2,023 | 1,796 | 1,379 | 1,648 | 2,253 |
| 1995 | 1,918 | 1,751 | 1,975 | 1,685 | 1,198 | 1,219 | 1,413 | 1,898 | 1,470 | 1,572 | 1,291 | 1,467 |
| 1996 | 1,859 | 1,800 | 1,288 | 1,442 | 1,539 | 1,409 | 1,613 | 1,139 | 1,653 | 1,435 | 934 | 1,637 |
| 1997 | 1,882 | 1,815 | 1,598 | 1,403 | 1,518 | 1,600 | 1,328 | 1,179 | 1,407 | 1,568 | 1,859 | 1,463 |
| 1998 | 1,359 | 1,206 | 1,471 | 1,056 | 1,477 | 1,697 | 1,891 | 757 | 831 | 1,303 | 1,467 | 1,257 |
| 1999 | 1,670 | 1,450 | 872 | 1,046 | 725 | 1,384 | 1,375 | 1,091 | 1,058 | 1,057 | 1,235 | 1,389 |
| 2000 | 1,397 | 1,088 | 1,342 | 1,242 | 1,007 | 1,252 | 1,302 | 1,010 | 1,072 | 1,104 | 1,450 | 1,397 |
| 2001 | 1,608 | 1,277 | 1,085 | 1,038 | 1,286 | 1,964 | 1,462 | 1,331 | 1,380 | 1,443 | 1,615 | 1,714 |
| 2002 | 1,643 | 1,770 | 1,633 | 1,542 | 1,444 | 1,788 | 1,557 | 1,740 | 1,865 | 974 | 1,262 | 1,631 |
| 2003 | 1,351 | 1,222 | 1,266 | 1,323 | 1,293 | 1,513 | 1,357 | 1,040 | 1,179 | 1,219 | 1,181 | 1,606 |
| 2004 | 946 | 1,171 | 1,172 | 1,152 | 1,233 | 1,282 | 1,347 | 1,421 | 1,377 | 1,285 | 1,552 | 1,734 |
| 2005 | 1,511 | 1,372 | 1,269 | 1,439 | 964 | 1,439 | 1,371 | 1,178 | 1,284 | 1,325 | 1,153 | 940 |
| 2006 | 1,171 | 1,249 | 1,231 | 21 | ||||||||
| 2009 | 1 | 1 | 1 | 1 | ||||||||
| 2010 | 2 | 3 | 3 | 4 | 4 | 6 | 4 | 4 | 3 | 3 | 3 | 2 |
| 2011 | 2 | 3 | 3 | 3 | 2 | 4 | 2 | 8 | 2 | 2 | 2 | 4 |
| 2012 | 5 | 7 | 8 | 6 | 5 | 5 | 4 | 11 | 9 | 6 | 3 | 3 |
| 2013 | 4 | 5 | 6 | 7 | 6 | 7 | 5 | 8 | 7 | 6 | 6 | 6 |
| 2014 | 5 | 6 | 6 | 7 | 8 | 7 | 6 | 9 | 9 | 6 | 6 | 5 |
| 2015 | 2 | 1 | 1 | 3 | 6 | 7 | 4 | 4 | 4 | 4 | 4 | 5 |
| 2016 | 4 | 4 | 4 | 4 | 6 | 8 | 4 | 3 | 5 | 4 | 4 | 5 |
| 2017 | 5 | 5 | 5 | 5 | 7 | 8 | 5 | 5 | 5 | 6 | 7 | 7 |
| 2018 | 6 | 6 | 5 | 4 | 5 | 8 | 6 | 6 | 4 | 6 | 6 | 5 |
| 2019 | 5 | 5 | 4 | 3 | 3 | 4 | 4 | 4 | 5 | 4 | 7 | 2 |
| 2020 | 3 | 5 | 5 | 5 | 4 | 4 | 4 | 4 | 3 | 5 | 5 | 4 |
| 2021 | 5 | 5 | 5 | 5 | 5 | 5 | 4 | 4 | 5 | 4 | 5 | 5 |
| 2022 | 3 | 4 | 4 | 3 | 3 | 4 | 3 | 3 | 4 | 4 | 4 | 4 |
| 2023 | 4 | 4 | 3 | 4 | 4 | 3 | 2 | 4 | 3 | 4 | 4 | 4 |
| 2024 | 4 | |||||||||||
| - = No Data Reported; -- = Not Applicable; NA = Not Available; W = Withheld to avoid disclosure of individual company data. |
| Release Date: 3/29/2024 |
| Next Release Date: 4/30/2024 |