|
Download Data (XLS File) |
|
||||||||
|
||||||||
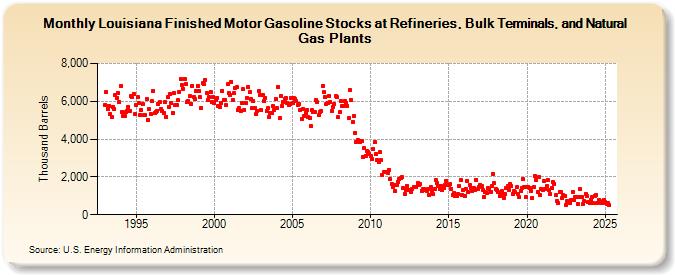
| Louisiana Finished Motor Gasoline Stocks at Refineries, Bulk Terminals, and Natural Gas Plants (Thousand Barrels) | ||||||||
| Year | Jan | Feb | Mar | Apr | May | Jun | Jul | Aug | Sep | Oct | Nov | Dec |
|---|---|---|---|---|---|---|---|---|---|---|---|---|
| 1993 | 5,811 | 6,482 | 5,607 | 5,776 | 5,336 | 5,154 | 5,718 | 5,606 | 6,318 | 6,192 | 6,439 | 5,955 |
| 1994 | 6,817 | 5,456 | 5,224 | 5,224 | 5,424 | 5,480 | 5,720 | 5,494 | 6,287 | 6,238 | 6,395 | 5,306 |
| 1995 | 5,791 | 6,210 | 5,890 | 5,287 | 5,542 | 5,846 | 5,257 | 5,250 | 6,109 | 5,006 | 5,574 | 5,347 |
| 1996 | 5,989 | 6,561 | 5,379 | 5,422 | 5,504 | 5,832 | 5,943 | 5,602 | 5,498 | 5,397 | 5,957 | 5,187 |
| 1997 | 6,219 | 5,702 | 6,376 | 5,911 | 5,384 | 6,447 | 5,816 | 5,806 | 6,052 | 6,500 | 7,176 | 6,856 |
| 1998 | 6,672 | 7,197 | 6,916 | 5,939 | 6,029 | 6,265 | 5,868 | 6,825 | 6,252 | 6,108 | 6,551 | 6,808 |
| 1999 | 6,541 | 6,215 | 5,664 | 6,960 | 6,909 | 7,142 | 6,451 | 6,090 | 6,223 | 6,492 | 5,950 | 6,227 |
| 2000 | 5,912 | 6,070 | 6,193 | 5,727 | 5,684 | 5,924 | 6,565 | 6,052 | 6,057 | 5,799 | 6,889 | 6,414 |
| 2001 | 6,345 | 7,040 | 6,089 | 6,414 | 6,716 | 6,737 | 5,564 | 5,622 | 5,497 | 5,934 | 6,635 | 5,556 |
| 2002 | 5,927 | 6,181 | 6,754 | 6,469 | 6,109 | 5,641 | 6,015 | 5,668 | 5,338 | 5,503 | 6,528 | 6,319 |
| 2003 | 5,518 | 6,341 | 6,012 | 6,200 | 5,465 | 5,623 | 5,146 | 5,401 | 5,405 | 5,727 | 5,539 | 6,111 |
| 2004 | 5,647 | 6,763 | 5,108 | 6,290 | 5,765 | 5,983 | 6,131 | 6,170 | 5,918 | 5,796 | 5,856 | 6,170 |
| 2005 | 5,888 | 6,152 | 6,128 | 6,012 | 5,817 | 5,834 | 5,558 | 5,049 | 5,614 | 5,234 | 5,397 | 5,553 |
| 2006 | 5,168 | 5,127 | 4,689 | 5,517 | 5,411 | 5,409 | 6,047 | 5,972 | 5,257 | 5,431 | 5,497 | 6,809 |
| 2007 | 6,466 | 6,253 | 5,876 | 5,921 | 6,288 | 5,971 | 5,466 | 5,723 | 5,853 | 6,290 | 6,212 | 5,146 |
| 2008 | 5,429 | 6,036 | 5,752 | 5,749 | 6,011 | 5,931 | 5,746 | 5,097 | 6,609 | 6,056 | 4,916 | 5,209 |
| 2009 | 4,336 | 3,865 | 3,959 | 3,898 | 3,837 | 3,919 | 3,076 | 3,518 | 3,121 | 3,386 | 3,334 | 3,223 |
| 2010 | 3,086 | 2,957 | 3,461 | 3,829 | 3,188 | 2,893 | 2,785 | 3,298 | 2,879 | 2,106 | 2,240 | 2,281 |
| 2011 | 2,267 | 2,211 | 2,389 | 1,875 | 1,647 | 1,482 | 1,553 | 1,234 | 1,571 | 1,732 | 1,891 | 1,922 |
| 2012 | 1,972 | 1,405 | 1,100 | 1,314 | 1,529 | 1,307 | 1,283 | 1,182 | 1,363 | 1,444 | 1,444 | 1,448 |
| 2013 | 1,670 | 1,597 | 1,637 | 1,272 | 1,336 | 1,341 | 1,328 | 1,269 | 1,364 | 1,056 | 1,485 | 1,276 |
| 2014 | 1,074 | 1,347 | 1,823 | 1,676 | 1,535 | 1,336 | 1,510 | 1,286 | 1,404 | 1,574 | 1,802 | 1,586 |
| 2015 | 1,551 | 1,606 | 1,379 | 1,029 | 1,150 | 982 | 988 | 1,102 | 1,505 | 1,839 | 1,046 | 1,293 |
| 2016 | 982 | 1,351 | 1,787 | 1,179 | 1,555 | 1,433 | 1,266 | 1,411 | 1,288 | 1,858 | 1,339 | 1,488 |
| 2017 | 1,593 | 1,510 | 1,324 | 959 | 1,178 | 1,175 | 1,387 | 1,350 | 1,214 | 1,512 | 2,147 | 1,662 |
| 2018 | 1,380 | 1,291 | 1,199 | 984 | 1,120 | 1,240 | 906 | 1,070 | 1,411 | 1,511 | 1,315 | 1,623 |
| 2019 | 1,516 | 1,103 | 1,239 | 1,187 | 1,448 | 1,087 | 945 | 1,257 | 1,399 | 1,888 | 1,486 | 923 |
| 2020 | 1,482 | 1,468 | 1,397 | 1,248 | 896 | 1,451 | 2,036 | 1,829 | 1,208 | 1,987 | 1,030 | 1,383 |
| 2021 | 1,297 | 1,781 | 1,383 | 1,493 | 1,820 | 1,322 | 1,092 | 1,423 | 1,712 | 1,641 | 1,022 | 731 |
| 2022 | 646 | 1,204 | 1,204 | 864 | 1,044 | 975 | 528 | 744 | 650 | 594 | 771 | 1,206 |
| 2023 | 759 | 946 | 919 | 583 | 937 | 1,334 | 945 | 581 | 709 | 1,103 | 976 | 679 |
| 2024 | 605 | |||||||||||
| - = No Data Reported; -- = Not Applicable; NA = Not Available; W = Withheld to avoid disclosure of individual company data. |
| Release Date: 3/29/2024 |
| Next Release Date: 4/30/2024 |