|
Download Data (XLS File) |
|
||||||||
|
||||||||
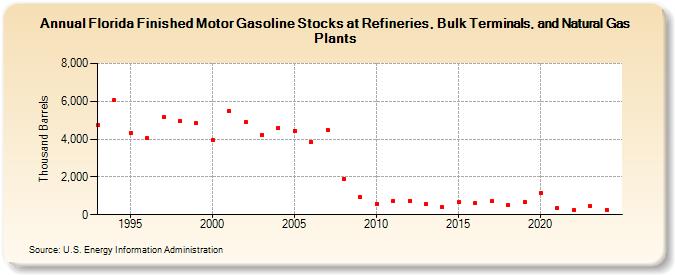
| Florida Finished Motor Gasoline Stocks at Refineries, Bulk Terminals, and Natural Gas Plants (Thousand Barrels) | ||||||||
| Decade | Year-0 | Year-1 | Year-2 | Year-3 | Year-4 | Year-5 | Year-6 | Year-7 | Year-8 | Year-9 |
|---|---|---|---|---|---|---|---|---|---|---|
| 1990's | 4,737 | 6,045 | 4,319 | 4,037 | 5,147 | 4,961 | 4,830 | |||
| 2000's | 3,963 | 5,480 | 4,915 | 4,232 | 4,612 | 4,451 | 3,851 | 4,484 | 1,877 | 914 |
| 2010's | 586 | 734 | 747 | 545 | 397 | 652 | 630 | 732 | 508 | 676 |
| 2020's | 1,156 | 355 | 244 | 471 |
| - = No Data Reported; -- = Not Applicable; NA = Not Available; W = Withheld to avoid disclosure of individual company data. |
| Release Date: 3/29/2024 |
| Next Release Date: 8/30/2024 |