|
Download Data (XLS File) |
|
||||||||
|
||||||||
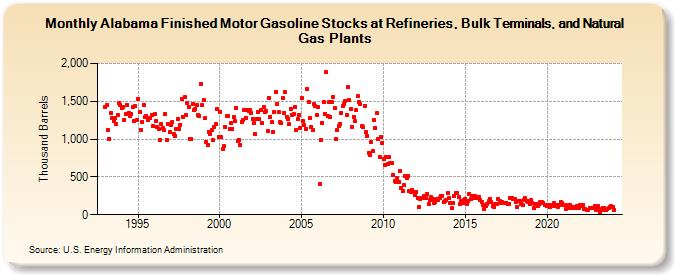
| Alabama Finished Motor Gasoline Stocks at Refineries, Bulk Terminals, and Natural Gas Plants (Thousand Barrels) | ||||||||
| Year | Jan | Feb | Mar | Apr | May | Jun | Jul | Aug | Sep | Oct | Nov | Dec |
|---|---|---|---|---|---|---|---|---|---|---|---|---|
| 1993 | 1,429 | 1,449 | 1,117 | 1,005 | 1,344 | 1,273 | 1,244 | 1,275 | 1,206 | 1,319 | 1,478 | 1,451 |
| 1994 | 1,405 | 1,418 | 1,257 | 1,328 | 1,457 | 1,349 | 1,308 | 1,338 | 1,420 | 1,234 | 1,432 | 1,248 |
| 1995 | 1,533 | 1,364 | 1,123 | 1,230 | 1,455 | 1,288 | 1,304 | 1,251 | 1,284 | 1,280 | 1,315 | 1,168 |
| 1996 | 1,330 | 1,245 | 1,155 | 1,132 | 985 | 1,204 | 1,143 | 1,119 | 1,331 | 992 | 1,199 | 1,093 |
| 1997 | 1,186 | 1,228 | 1,065 | 1,042 | 1,133 | 1,266 | 1,133 | 1,190 | 1,535 | 1,297 | 1,552 | 1,322 |
| 1998 | 1,479 | 1,430 | 1,005 | 998 | 1,466 | 1,382 | 1,397 | 1,448 | 1,319 | 1,307 | 1,723 | 1,454 |
| 1999 | 1,518 | 1,275 | 964 | 918 | 1,096 | 1,072 | 1,123 | 987 | 1,166 | 1,206 | 1,392 | 1,033 |
| 2000 | 1,362 | 1,022 | 869 | 909 | 1,162 | 1,299 | 1,309 | 1,138 | 1,208 | 1,140 | 1,287 | 1,241 |
| 2001 | 1,412 | 977 | 986 | 926 | 1,231 | 1,253 | 1,386 | 1,279 | 1,387 | 1,373 | 1,388 | 1,351 |
| 2002 | 1,262 | 1,216 | 1,068 | 1,272 | 1,362 | 1,263 | 1,380 | 1,209 | 1,427 | 1,360 | 1,368 | 1,106 |
| 2003 | 1,548 | 1,293 | 1,220 | 1,100 | 1,361 | 1,621 | 1,466 | 1,352 | 1,224 | 1,209 | 1,542 | 1,342 |
| 2004 | 1,617 | 1,296 | 1,269 | 1,198 | 1,403 | 1,321 | 1,328 | 1,429 | 1,120 | 1,263 | 1,319 | 1,153 |
| 2005 | 1,539 | 1,238 | 1,183 | 1,139 | 1,665 | 1,491 | 1,280 | 1,160 | 1,119 | 1,463 | 1,437 | 1,318 |
| 2006 | 1,423 | 404 | 989 | 1,210 | 1,484 | 1,332 | 1,884 | 1,311 | 1,486 | 1,293 | 1,487 | 1,559 |
| 2007 | 1,406 | 1,002 | 1,117 | 1,175 | 1,203 | 1,348 | 1,433 | 1,463 | 1,507 | 1,319 | 1,691 | 1,514 |
| 2008 | 1,392 | 1,157 | 1,296 | 1,237 | 1,383 | 1,570 | 1,492 | 1,463 | 1,169 | 1,154 | 1,444 | 1,090 |
| 2009 | 1,039 | 817 | 792 | 966 | 839 | 1,247 | 1,150 | 1,343 | 997 | 762 | 1,030 | 951 |
| 2010 | 736 | 664 | 763 | 671 | 760 | 680 | 683 | 528 | 441 | 437 | 482 | 433 |
| 2011 | 573 | 356 | 317 | 387 | 512 | 479 | 511 | 320 | 295 | 331 | 306 | 261 |
| 2012 | 298 | 222 | 107 | 214 | 225 | 226 | 254 | 218 | 280 | 141 | 194 | 230 |
| 2013 | 208 | 155 | 174 | 209 | 195 | 224 | 246 | 250 | 171 | 177 | 200 | 283 |
| 2014 | 217 | 152 | 85 | 154 | 254 | 291 | 292 | 230 | 142 | 179 | 151 | 198 |
| 2015 | 213 | 148 | 181 | 276 | 214 | 253 | 217 | 246 | 220 | 228 | 234 | 191 |
| 2016 | 167 | 126 | 79 | 115 | 141 | 180 | 211 | 165 | 110 | 104 | 148 | 148 |
| 2017 | 205 | 187 | 157 | 170 | 151 | 152 | 156 | 143 | 146 | 227 | 219 | 205 |
| 2018 | 213 | 164 | 98 | 182 | 180 | 148 | 128 | 196 | 215 | 185 | 166 | 142 |
| 2019 | 193 | 160 | 91 | 138 | 139 | 121 | 141 | 169 | 162 | 157 | 126 | 123 |
| 2020 | 115 | 132 | 106 | 120 | 129 | 156 | 113 | 122 | 104 | 134 | 169 | 155 |
| 2021 | 130 | 133 | 81 | 95 | 135 | 129 | 85 | 103 | 83 | 86 | 110 | 88 |
| 2022 | 128 | 117 | 135 | 72 | 74 | 61 | 68 | 87 | 85 | 90 | 95 | 112 |
| 2023 | 68 | 111 | 71 | 40 | 59 | 91 | 89 | 65 | 78 | 83 | 99 | 110 |
| 2024 | 106 | 67 | 109 | 82 | 79 | 79 | ||||||
| - = No Data Reported; -- = Not Applicable; NA = Not Available; W = Withheld to avoid disclosure of individual company data. |
| Release Date: 8/30/2024 |
| Next Release Date: 9/30/2024 |