|
Download Data (XLS File) |
|
||||||||
|
||||||||
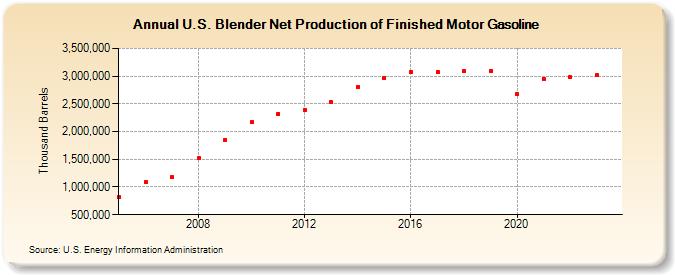
| U.S. Blender Net Production of Finished Motor Gasoline (Thousand Barrels) | ||||||||
| Decade | Year-0 | Year-1 | Year-2 | Year-3 | Year-4 | Year-5 | Year-6 | Year-7 | Year-8 | Year-9 |
|---|---|---|---|---|---|---|---|---|---|---|
| 2000's | 810,545 | 1,087,413 | 1,184,435 | 1,522,193 | 1,848,167 | |||||
| 2010's | 2,164,209 | 2,324,739 | 2,391,313 | 2,524,525 | 2,811,987 | 2,974,061 | 3,077,877 | 3,075,211 | 3,086,464 | 3,094,299 |
| 2020's | 2,672,051 | 2,950,711 | 2,983,483 | 3,014,682 |
| - = No Data Reported; -- = Not Applicable; NA = Not Available; W = Withheld to avoid disclosure of individual company data. |
| Release Date: 8/30/2024 |
| Next Release Date: 8/29/2025 |