|
Download Data (XLS File) |
|
||||||||
|
||||||||
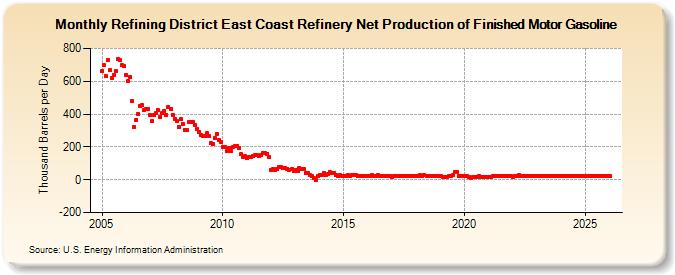
| Refining District East Coast Refinery Net Production of Finished Motor Gasoline (Thousand Barrels per Day) | ||||||||
| Year | Jan | Feb | Mar | Apr | May | Jun | Jul | Aug | Sep | Oct | Nov | Dec |
|---|---|---|---|---|---|---|---|---|---|---|---|---|
| 2005 | 665 | 698 | 629 | 731 | 668 | 621 | 637 | 661 | 734 | 729 | 698 | 690 |
| 2006 | 639 | 600 | 625 | 481 | 322 | 365 | 403 | 450 | 453 | 425 | 428 | 431 |
| 2007 | 392 | 357 | 393 | 404 | 423 | 381 | 406 | 420 | 395 | 444 | 432 | 396 |
| 2008 | 369 | 357 | 320 | 368 | 341 | 305 | 303 | 350 | 350 | 354 | 331 | 307 |
| 2009 | 289 | 271 | 266 | 264 | 282 | 264 | 226 | 217 | 252 | 277 | 241 | 232 |
| 2010 | 202 | 199 | 174 | 191 | 178 | 198 | 205 | 207 | 191 | 154 | 140 | 142 |
| 2011 | 132 | 136 | 141 | 143 | 149 | 149 | 142 | 150 | 163 | 160 | 159 | 138 |
| 2012 | 61 | 68 | 62 | 68 | 77 | 77 | 73 | 71 | 67 | 60 | 66 | 56 |
| 2013 | 60 | 55 | 72 | 68 | 64 | 42 | 44 | 31 | 23 | 9 | -2 | 23 |
| 2014 | 28 | 31 | 41 | 28 | 36 | 46 | 40 | 44 | 26 | 25 | 26 | 25 |
| 2015 | 23 | 25 | 27 | 25 | 28 | 26 | 28 | 25 | 23 | 24 | 22 | 22 |
| 2016 | 21 | 22 | 27 | 24 | 25 | 27 | 25 | 25 | 25 | 25 | 24 | 24 |
| 2017 | 19 | 20 | 23 | 22 | 22 | 21 | 24 | 25 | 25 | 25 | 25 | 24 |
| 2018 | 21 | 22 | 26 | 23 | 26 | 23 | 23 | 22 | 23 | 24 | 22 | 21 |
| 2019 | 21 | 19 | 19 | 18 | 22 | 23 | 27 | 46 | 47 | 23 | 23 | 23 |
| 2020 | 22 | 22 | 19 | 13 | 15 | 18 | 19 | 20 | 19 | 18 | 17 | 17 |
| 2021 | 16 | 16 | 20 | 23 | 24 | 25 | 25 | 23 | 22 | 23 | 21 | 23 |
| 2022 | 18 | 22 | 22 | 26 | 20 | 23 | 24 | 25 | 24 | 22 | 21 | 21 |
| 2023 | 20 | 22 | 22 | 22 | 21 | 22 | 22 | 22 | 21 | 22 | 22 | 21 |
| 2024 | 20 | |||||||||||
| - = No Data Reported; -- = Not Applicable; NA = Not Available; W = Withheld to avoid disclosure of individual company data. |
| Release Date: 3/29/2024 |
| Next Release Date: 4/30/2024 |