|
Download Data (XLS File) |
|
||||||||
|
||||||||
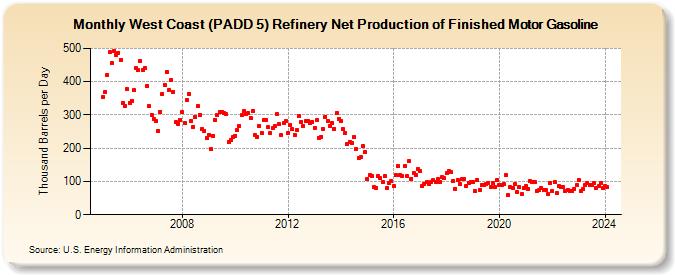
| West Coast (PADD 5) Refinery Net Production of Finished Motor Gasoline (Thousand Barrels per Day) | ||||||||
| Year | Jan | Feb | Mar | Apr | May | Jun | Jul | Aug | Sep | Oct | Nov | Dec |
|---|---|---|---|---|---|---|---|---|---|---|---|---|
| 2005 | 355 | 370 | 421 | 488 | 456 | 492 | 481 | 487 | 466 | 336 | 328 | 377 |
| 2006 | 337 | 343 | 374 | 440 | 434 | 462 | 435 | 441 | 386 | 326 | 300 | 289 |
| 2007 | 282 | 252 | 309 | 363 | 390 | 430 | 375 | 404 | 370 | 278 | 274 | 286 |
| 2008 | 308 | 276 | 345 | 363 | 282 | 265 | 293 | 327 | 301 | 257 | 252 | 230 |
| 2009 | 241 | 197 | 238 | 286 | 300 | 310 | 310 | 306 | 302 | 219 | 225 | 234 |
| 2010 | 237 | 254 | 268 | 299 | 312 | 302 | 306 | 290 | 312 | 240 | 235 | 267 |
| 2011 | 246 | 284 | 284 | 263 | 246 | 260 | 267 | 302 | 272 | 239 | 276 | 281 |
| 2012 | 246 | 270 | 257 | 240 | 255 | 297 | 278 | 268 | 282 | 283 | 275 | 279 |
| 2013 | 262 | 284 | 232 | 235 | 259 | 295 | 282 | 266 | 275 | 259 | 306 | 287 |
| 2014 | 283 | 257 | 247 | 212 | 220 | 216 | 233 | 197 | 169 | 173 | 206 | 189 |
| 2015 | 106 | 118 | 116 | 82 | 81 | 115 | 109 | 99 | 115 | 81 | 96 | 100 |
| 2016 | 86 | 118 | 146 | 119 | 115 | 146 | 115 | 161 | 108 | 124 | 119 | 137 |
| 2017 | 131 | 87 | 93 | 97 | 91 | 99 | 103 | 98 | 106 | 99 | 112 | 110 |
| 2018 | 124 | 130 | 127 | 102 | 78 | 104 | 91 | 106 | 108 | 87 | 96 | 98 |
| 2019 | 97 | 70 | 104 | 75 | 90 | 88 | 92 | 96 | 84 | 95 | 82 | 103 |
| 2020 | 89 | 89 | 91 | 118 | 59 | 83 | 81 | 91 | 67 | 82 | 61 | 80 |
| 2021 | 86 | 78 | 100 | 98 | 97 | 72 | 73 | 80 | 73 | 74 | 63 | 96 |
| 2022 | 71 | 98 | 65 | 85 | 83 | 82 | 70 | 74 | 71 | 72 | 78 | 88 |
| 2023 | 104 | 71 | 77 | 90 | 95 | 88 | 89 | 95 | 80 | 85 | 94 | 80 |
| 2024 | 86 | |||||||||||
| - = No Data Reported; -- = Not Applicable; NA = Not Available; W = Withheld to avoid disclosure of individual company data. |
| Release Date: 3/29/2024 |
| Next Release Date: 4/30/2024 |