|
Download Data (XLS File) |
|
||||||||
|
||||||||
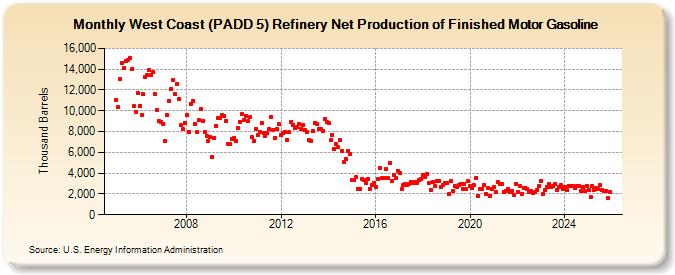
| West Coast (PADD 5) Refinery Net Production of Finished Motor Gasoline (Thousand Barrels) | ||||||||
| Year | Jan | Feb | Mar | Apr | May | Jun | Jul | Aug | Sep | Oct | Nov | Dec |
|---|---|---|---|---|---|---|---|---|---|---|---|---|
| 2005 | 11,008 | 10,361 | 13,056 | 14,640 | 14,128 | 14,768 | 14,917 | 15,085 | 13,982 | 10,414 | 9,838 | 11,687 |
| 2006 | 10,461 | 9,617 | 11,584 | 13,206 | 13,452 | 13,874 | 13,479 | 13,683 | 11,565 | 10,099 | 9,000 | 8,966 |
| 2007 | 8,744 | 7,050 | 9,586 | 10,903 | 12,098 | 12,914 | 11,622 | 12,527 | 11,113 | 8,619 | 8,213 | 8,861 |
| 2008 | 9,552 | 8,005 | 10,684 | 10,901 | 8,754 | 7,948 | 9,068 | 10,129 | 9,017 | 7,954 | 7,550 | 7,137 |
| 2009 | 7,481 | 5,522 | 7,393 | 8,575 | 9,312 | 9,294 | 9,607 | 9,489 | 9,059 | 6,780 | 6,756 | 7,239 |
| 2010 | 7,343 | 7,123 | 8,305 | 8,966 | 9,686 | 9,067 | 9,490 | 8,989 | 9,364 | 7,451 | 7,062 | 8,277 |
| 2011 | 7,635 | 7,942 | 8,801 | 7,883 | 7,612 | 7,813 | 8,271 | 9,353 | 8,150 | 7,408 | 8,270 | 8,701 |
| 2012 | 7,628 | 7,829 | 7,953 | 7,191 | 7,919 | 8,921 | 8,624 | 8,308 | 8,474 | 8,769 | 8,263 | 8,642 |
| 2013 | 8,126 | 7,964 | 7,199 | 7,062 | 8,014 | 8,850 | 8,751 | 8,249 | 8,238 | 8,020 | 9,181 | 8,889 |
| 2014 | 8,782 | 7,209 | 7,648 | 6,355 | 6,815 | 6,475 | 7,219 | 6,116 | 5,076 | 5,368 | 6,177 | 5,862 |
| 2015 | 3,296 | 3,296 | 3,590 | 2,457 | 2,507 | 3,457 | 3,370 | 3,067 | 3,445 | 2,506 | 2,892 | 3,087 |
| 2016 | 2,653 | 3,427 | 4,541 | 3,555 | 3,555 | 4,384 | 3,574 | 4,982 | 3,230 | 3,854 | 3,560 | 4,243 |
| 2017 | 4,046 | 2,441 | 2,885 | 2,923 | 2,816 | 2,973 | 3,188 | 3,038 | 3,192 | 3,084 | 3,361 | 3,409 |
| 2018 | 3,834 | 3,637 | 3,927 | 3,068 | 2,403 | 3,134 | 2,807 | 3,277 | 3,251 | 2,705 | 2,866 | 3,035 |
| 2019 | 3,016 | 1,952 | 3,219 | 2,236 | 2,777 | 2,641 | 2,857 | 2,978 | 2,520 | 2,951 | 2,463 | 3,201 |
| 2020 | 2,764 | 2,570 | 2,824 | 3,550 | 1,832 | 2,479 | 2,520 | 2,813 | 1,997 | 2,533 | 1,827 | 2,487 |
| 2021 | 2,652 | 2,173 | 3,107 | 2,928 | 3,001 | 2,160 | 2,270 | 2,486 | 2,198 | 2,279 | 1,879 | 2,972 |
| 2022 | 2,197 | 2,751 | 2,012 | 2,559 | 2,585 | 2,462 | 2,165 | 2,281 | 2,131 | 2,225 | 2,353 | 2,724 |
| 2023 | 3,218 | 1,986 | 2,394 | 2,697 | 2,950 | 2,628 | 2,771 | 2,932 | 2,408 | 2,634 | 2,831 | 2,484 |
| 2024 | 2,665 | 2,373 | 2,767 | 2,778 | ||||||||
| - = No Data Reported; -- = Not Applicable; NA = Not Available; W = Withheld to avoid disclosure of individual company data. |
| Release Date: 6/28/2024 |
| Next Release Date: 7/31/2024 |