|
Download Data (XLS File) |
|
||||||||
|
||||||||
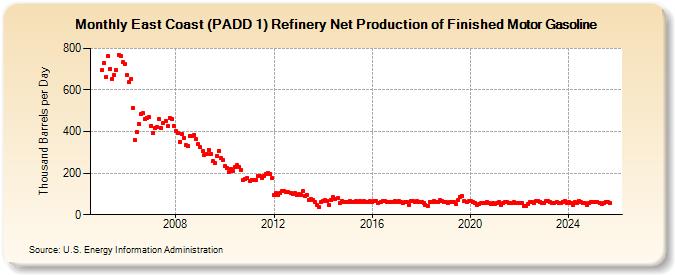
| East Coast (PADD 1) Refinery Net Production of Finished Motor Gasoline (Thousand Barrels per Day) | ||||||||
| Year | Jan | Feb | Mar | Apr | May | Jun | Jul | Aug | Sep | Oct | Nov | Dec |
|---|---|---|---|---|---|---|---|---|---|---|---|---|
| 2005 | 697 | 732 | 663 | 762 | 703 | 655 | 670 | 695 | 770 | 762 | 734 | 725 |
| 2006 | 673 | 636 | 652 | 515 | 357 | 398 | 438 | 484 | 488 | 460 | 467 | 468 |
| 2007 | 428 | 391 | 419 | 423 | 458 | 418 | 441 | 452 | 427 | 466 | 461 | 429 |
| 2008 | 405 | 392 | 351 | 389 | 370 | 334 | 332 | 378 | 379 | 385 | 362 | 340 |
| 2009 | 324 | 305 | 287 | 293 | 313 | 294 | 258 | 247 | 284 | 308 | 272 | 265 |
| 2010 | 234 | 224 | 205 | 221 | 210 | 231 | 239 | 231 | 216 | 169 | 171 | 177 |
| 2011 | 164 | 169 | 167 | 166 | 184 | 188 | 178 | 186 | 198 | 200 | 198 | 176 |
| 2012 | 94 | 104 | 94 | 105 | 115 | 114 | 110 | 108 | 103 | 98 | 104 | 93 |
| 2013 | 98 | 94 | 113 | 92 | 95 | 72 | 74 | 70 | 59 | 48 | 37 | 59 |
| 2014 | 64 | 70 | 66 | 46 | 71 | 84 | 76 | 78 | 57 | 68 | 63 | 60 |
| 2015 | 63 | 65 | 62 | 62 | 64 | 62 | 68 | 61 | 64 | 60 | 63 | 64 |
| 2016 | 62 | 65 | 67 | 58 | 61 | 64 | 64 | 63 | 63 | 62 | 63 | 67 |
| 2017 | 61 | 65 | 63 | 57 | 59 | 61 | 48 | 64 | 65 | 62 | 64 | 61 |
| 2018 | 63 | 56 | 48 | 44 | 63 | 63 | 64 | 62 | 62 | 69 | 65 | 63 |
| 2019 | 61 | 57 | 62 | 60 | 60 | 51 | 69 | 86 | 88 | 68 | 63 | 64 |
| 2020 | 67 | 63 | 57 | 48 | 51 | 55 | 55 | 56 | 61 | 55 | 52 | 55 |
| 2021 | 53 | 54 | 60 | 47 | 55 | 62 | 60 | 56 | 55 | 59 | 57 | 58 |
| 2022 | 55 | 57 | 42 | 43 | 52 | 59 | 60 | 56 | 65 | 65 | 63 | 55 |
| 2023 | 58 | 65 | 67 | 60 | 57 | 58 | 60 | 58 | 57 | 63 | 65 | 58 |
| 2024 | 61 | 58 | ||||||||||
| - = No Data Reported; -- = Not Applicable; NA = Not Available; W = Withheld to avoid disclosure of individual company data. |
| Release Date: 4/30/2024 |
| Next Release Date: 5/31/2024 |