|
Download Data (XLS File) |
|
||||||||
|
||||||||
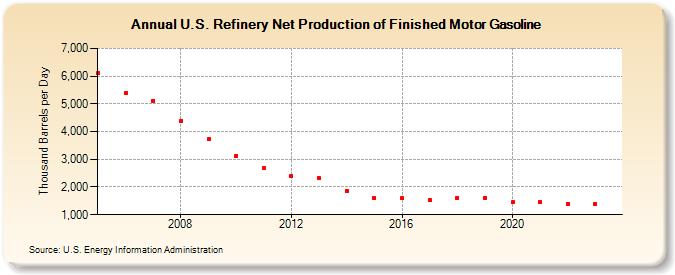
| U.S. Refinery Net Production of Finished Motor Gasoline (Thousand Barrels per Day) | ||||||||
| Decade | Year-0 | Year-1 | Year-2 | Year-3 | Year-4 | Year-5 | Year-6 | Year-7 | Year-8 | Year-9 |
|---|---|---|---|---|---|---|---|---|---|---|
| 2000's | 6,097 | 5,384 | 5,113 | 4,389 | 3,722 | |||||
| 2010's | 3,129 | 2,688 | 2,393 | 2,318 | 1,866 | 1,606 | 1,586 | 1,529 | 1,605 | 1,618 |
| 2020's | 1,441 | 1,445 | 1,395 | 1,387 |
| - = No Data Reported; -- = Not Applicable; NA = Not Available; W = Withheld to avoid disclosure of individual company data. |
| Release Date: 3/29/2024 |
| Next Release Date: 8/30/2024 |