|
Download Data (XLS File) |
|
||||||||
|
||||||||
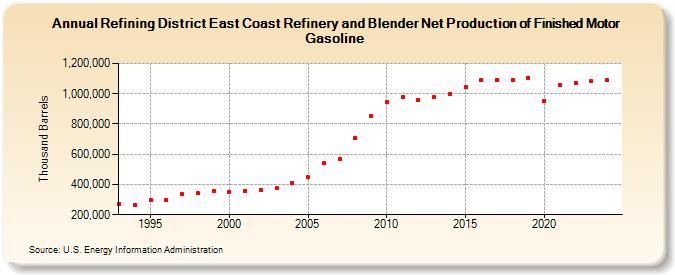
| Refining District East Coast Refinery and Blender Net Production of Finished Motor Gasoline (Thousand Barrels) | ||||||||
| Decade | Year-0 | Year-1 | Year-2 | Year-3 | Year-4 | Year-5 | Year-6 | Year-7 | Year-8 | Year-9 |
|---|---|---|---|---|---|---|---|---|---|---|
| 1990's | 271,977 | 264,971 | 297,427 | 295,551 | 337,783 | 341,415 | 358,723 | |||
| 2000's | 352,544 | 357,833 | 364,493 | 375,145 | 411,486 | 447,254 | 541,890 | 567,640 | 709,455 | 851,500 |
| 2010's | 944,510 | 975,883 | 961,041 | 975,979 | 1,000,003 | 1,044,102 | 1,089,518 | 1,088,962 | 1,091,185 | 1,105,862 |
| 2020's | 950,757 | 1,055,317 | 1,072,823 | 1,083,013 |
| - = No Data Reported; -- = Not Applicable; NA = Not Available; W = Withheld to avoid disclosure of individual company data. |
| Release Date: 3/29/2024 |
| Next Release Date: 8/30/2024 |