|
Download Data (XLS File) |
|
||||||||
|
||||||||
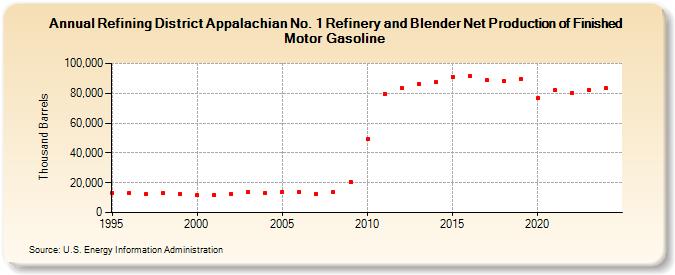
| Refining District Appalachian No. 1 Refinery and Blender Net Production of Finished Motor Gasoline (Thousand Barrels) | ||||||||
| Decade | Year-0 | Year-1 | Year-2 | Year-3 | Year-4 | Year-5 | Year-6 | Year-7 | Year-8 | Year-9 |
|---|---|---|---|---|---|---|---|---|---|---|
| 1990's | 13,127 | 13,166 | 12,347 | 12,977 | 12,685 | |||||
| 2000's | 11,756 | 11,917 | 12,521 | 13,642 | 13,286 | 13,657 | 13,808 | 12,542 | 13,757 | 20,733 |
| 2010's | 49,171 | 79,777 | 83,812 | 86,508 | 87,365 | 91,166 | 91,471 | 88,745 | 87,947 | 89,654 |
| 2020's | 76,573 | 82,136 | 80,319 | 82,085 |
| - = No Data Reported; -- = Not Applicable; NA = Not Available; W = Withheld to avoid disclosure of individual company data. |
| Release Date: 4/30/2024 |
| Next Release Date: 8/30/2024 |