|
Download Data (XLS File) |
|
||||||||
|
||||||||
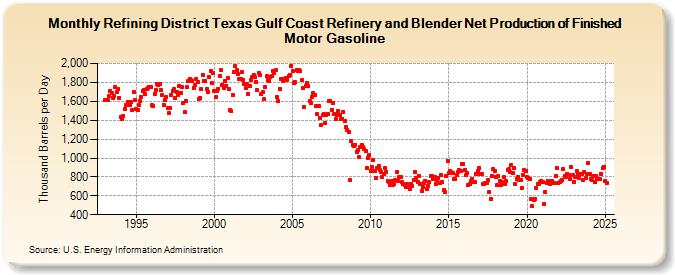
| Refining District Texas Gulf Coast Refinery and Blender Net Production of Finished Motor Gasoline (Thousand Barrels per Day) | ||||||||
| Year | Jan | Feb | Mar | Apr | May | Jun | Jul | Aug | Sep | Oct | Nov | Dec |
|---|---|---|---|---|---|---|---|---|---|---|---|---|
| 1993 | 1,611 | 1,611 | 1,612 | 1,656 | 1,708 | 1,690 | 1,634 | 1,651 | 1,754 | 1,696 | 1,730 | 1,638 |
| 1994 | 1,432 | 1,415 | 1,445 | 1,523 | 1,565 | 1,557 | 1,591 | 1,563 | 1,592 | 1,510 | 1,695 | 1,614 |
| 1995 | 1,515 | 1,510 | 1,556 | 1,608 | 1,645 | 1,713 | 1,723 | 1,675 | 1,733 | 1,739 | 1,753 | 1,748 |
| 1996 | 1,556 | 1,550 | 1,681 | 1,723 | 1,788 | 1,769 | 1,780 | 1,716 | 1,671 | 1,566 | 1,617 | 1,649 |
| 1997 | 1,527 | 1,477 | 1,528 | 1,670 | 1,714 | 1,727 | 1,637 | 1,696 | 1,670 | 1,765 | 1,687 | 1,753 |
| 1998 | 1,583 | 1,486 | 1,605 | 1,748 | 1,811 | 1,837 | 1,828 | 1,816 | 1,745 | 1,769 | 1,831 | 1,806 |
| 1999 | 1,619 | 1,640 | 1,726 | 1,881 | 1,817 | 1,817 | 1,730 | 1,700 | 1,853 | 1,921 | 1,797 | 1,903 |
| 2000 | 1,711 | 1,648 | 1,707 | 1,727 | 1,864 | 1,927 | 1,775 | 1,739 | 1,814 | 1,762 | 1,845 | 1,726 |
| 2001 | 1,510 | 1,494 | 1,662 | 1,913 | 1,974 | 1,927 | 1,884 | 1,837 | 1,840 | 1,911 | 1,826 | 1,787 |
| 2002 | 1,737 | 1,779 | 1,681 | 1,763 | 1,824 | 1,852 | 1,879 | 1,859 | 1,807 | 1,721 | 1,900 | 1,873 |
| 2003 | 1,674 | 1,698 | 1,621 | 1,754 | 1,864 | 1,826 | 1,819 | 1,857 | 1,872 | 1,918 | 1,902 | 1,928 |
| 2004 | 1,642 | 1,601 | 1,732 | 1,831 | 1,838 | 1,813 | 1,830 | 1,851 | 1,830 | 1,863 | 1,874 | 1,975 |
| 2005 | 1,917 | 1,797 | 1,804 | 1,932 | 1,922 | 1,935 | 1,917 | 1,824 | 1,745 | 1,540 | 1,767 | 1,789 |
| 2006 | 1,759 | 1,606 | 1,586 | 1,646 | 1,684 | 1,664 | 1,547 | 1,463 | 1,545 | 1,422 | 1,350 | 1,452 |
| 2007 | 1,467 | 1,366 | 1,457 | 1,467 | 1,600 | 1,598 | 1,511 | 1,582 | 1,465 | 1,411 | 1,460 | 1,496 |
| 2008 | 1,453 | 1,412 | 1,417 | 1,491 | 1,387 | 1,330 | 1,301 | 1,272 | 769 | 1,177 | 1,136 | 1,129 |
| 2009 | 1,139 | 1,068 | 1,088 | 1,007 | 1,119 | 1,138 | 1,118 | 1,092 | 1,074 | 899 | 1,005 | 1,030 |
| 2010 | 861 | 901 | 982 | 862 | 784 | 892 | 919 | 868 | 851 | 795 | 831 | 890 |
| 2011 | 854 | 756 | 742 | 712 | 754 | 718 | 725 | 763 | 850 | 760 | 801 | 802 |
| 2012 | 743 | 724 | 710 | 697 | 725 | 688 | 667 | 726 | 701 | 763 | 848 | 791 |
| 2013 | 749 | 807 | 730 | 655 | 692 | 739 | 760 | 676 | 706 | 747 | 810 | 805 |
| 2014 | 773 | 794 | 730 | 769 | 788 | 738 | 815 | 742 | 661 | 636 | 809 | 970 |
| 2015 | 844 | 862 | 848 | 846 | 780 | 781 | 823 | 853 | 869 | 864 | 935 | 932 |
| 2016 | 877 | 815 | 841 | 713 | 727 | 753 | 778 | 744 | 745 | 835 | 859 | 894 |
| 2017 | 826 | 827 | 725 | 727 | 732 | 734 | 767 | 636 | 567 | 812 | 884 | 861 |
| 2018 | 799 | 710 | 809 | 757 | 716 | 746 | 803 | 722 | 753 | 873 | 881 | 851 |
| 2019 | 921 | 846 | 896 | 727 | 779 | 802 | 763 | 772 | 680 | 825 | 868 | 865 |
| 2020 | 798 | 788 | 774 | 571 | 492 | 557 | 566 | 681 | 725 | 730 | 748 | 758 |
| 2021 | 745 | 516 | 641 | 738 | 759 | 746 | 725 | 756 | 736 | 734 | 807 | 895 |
| 2022 | 734 | 742 | 754 | 771 | 883 | 808 | 803 | 833 | 825 | 777 | 903 | 820 |
| 2023 | 748 | 801 | 866 | 827 | 789 | 837 | 829 | 765 | 863 | 786 | 830 | 956 |
| 2024 | 833 | |||||||||||
| - = No Data Reported; -- = Not Applicable; NA = Not Available; W = Withheld to avoid disclosure of individual company data. |
| Release Date: 3/29/2024 |
| Next Release Date: 4/30/2024 |