|
Download Data (XLS File) |
|
||||||||
|
||||||||
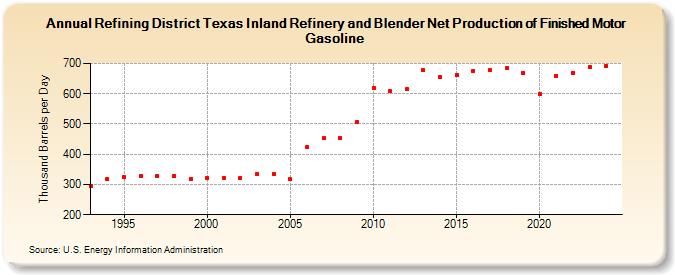
| Refining District Texas Inland Refinery and Blender Net Production of Finished Motor Gasoline (Thousand Barrels per Day) | ||||||||
| Decade | Year-0 | Year-1 | Year-2 | Year-3 | Year-4 | Year-5 | Year-6 | Year-7 | Year-8 | Year-9 |
|---|---|---|---|---|---|---|---|---|---|---|
| 1990's | 296 | 317 | 325 | 328 | 327 | 328 | 318 | |||
| 2000's | 321 | 323 | 322 | 334 | 336 | 317 | 425 | 452 | 454 | 505 |
| 2010's | 619 | 608 | 614 | 678 | 656 | 662 | 676 | 677 | 684 | 669 |
| 2020's | 600 | 660 | 670 | 689 |
| - = No Data Reported; -- = Not Applicable; NA = Not Available; W = Withheld to avoid disclosure of individual company data. |
| Release Date: 3/29/2024 |
| Next Release Date: 8/30/2024 |