|
Download Data (XLS File) |
|
||||||||
|
||||||||
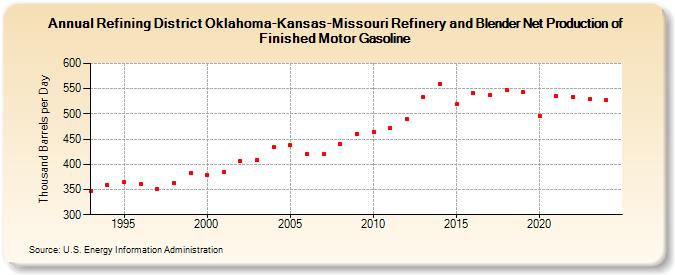
| Refining District Oklahoma-Kansas-Missouri Refinery and Blender Net Production of Finished Motor Gasoline (Thousand Barrels per Day) | ||||||||
| Decade | Year-0 | Year-1 | Year-2 | Year-3 | Year-4 | Year-5 | Year-6 | Year-7 | Year-8 | Year-9 |
|---|---|---|---|---|---|---|---|---|---|---|
| 1990's | 347 | 359 | 364 | 360 | 352 | 363 | 382 | |||
| 2000's | 379 | 385 | 407 | 409 | 434 | 438 | 421 | 421 | 440 | 461 |
| 2010's | 465 | 473 | 490 | 534 | 560 | 519 | 541 | 538 | 548 | 543 |
| 2020's | 496 | 535 | 534 | 530 |
| - = No Data Reported; -- = Not Applicable; NA = Not Available; W = Withheld to avoid disclosure of individual company data. |
| Release Date: 3/29/2024 |
| Next Release Date: 8/30/2024 |